Direct answer
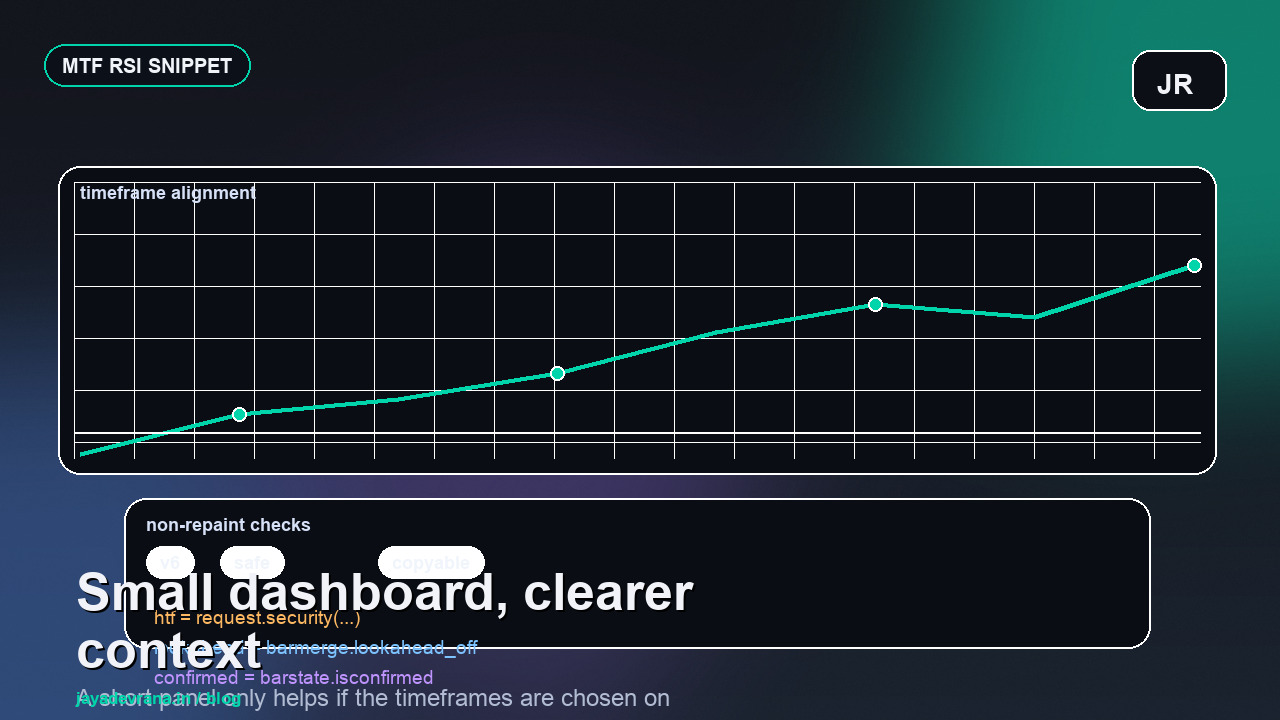
An MTF RSI dashboard only helps if the chosen timeframes actually add context to the decision. A tiny panel can be useful. A crowded one usually becomes background noise.
That is why short snippets rank well and also mislead people. The code can be short, but the timeframe choices still need intention.
Where people usually get this wrong
The usual mistake is adding more rows and more colors before deciding what the dashboard is for.
- mixing unrelated timeframes that create more conflict than clarity
- treating the RSI panel like a trade system on its own
- using too many table or label elements for a tiny decision task
- forgetting to test whether the panel actually changes the trade decision
Copyable example
This is the kind of base pattern I prefer to start from before adding more filters, styling, or automation layers.
//@version=6
indicator("MTF RSI dashboard", overlay = false)

rsi15 = request.security(syminfo.tickerid, "15", ta.rsi(close, 14))
rsi60 = request.security(syminfo.tickerid, "60", ta.rsi(close, 14))
rsiD = request.security(syminfo.tickerid, "D", ta.rsi(close, 14))

plot(rsi15, "RSI 15m", color.new(color.teal, 0))
plot(rsi60, "RSI 1h", color.new(color.orange, 0))
plot(rsiD, "RSI 1D", color.new(color.purple, 0))How I would handle it in a real build
I keep this kind of dashboard narrow: two or three timeframes at most, one clear use case, and enough visual simplicity that the trader can read it in one glance.
If your current script or workflow already exists and the behavior is drifting, send the setup or code on WhatsApp. I can usually tell quickly whether it needs a rewrite, a migration pass, or a smaller audit.
WhatsApp for a 3-minute quoteWhat to read next
If this topic is part of a bigger TradingView or Pine Script workflow for you, these are the most useful follow-up guides on the site.
- Multi-timeframe Pine Script indicator
- request.security_lower_tf guide
- Fix repainting with request.security
Send the chart idea, broker, market, and goal on WhatsApp. I can usually tell you quickly whether it needs a custom indicator, a strategy audit, an alert fix, or a broker-ready automation layer.
Related services
Frequently asked questions
Should I optimize this for backtests first or live behavior first?
Live behavior comes first. A cleaner live model usually gives you a more believable backtest, while the reverse is not always true.
Is Pine Script v6 the safer default for new examples now?
Yes. Traders still search with older wording, but new examples are usually easier to maintain and explain in v6.
When is the next step a service page instead of another tutorial?
Once you know the logic you want and the remaining problem is implementation, audit, or broker-ready structure, the service path is usually the better next move.
Primary sources and references
I take on Pine Script indicators, TradingView automation layers, strategy audits, and broker-aware execution workflows when the goal is clear and the live behavior actually matters.