What this script is trying to do
Jayadev Rana published Buy/Sell Volume Analysis for free so traders can read candle-based buying and selling pressure, session participation, and short-term control shifts without needing a complicated order-flow stack.
Traders who want a simpler way to read volume pressure on-chart, and buyers who want proof that Jayadev can turn practical market questions into clear Pine Script tools.
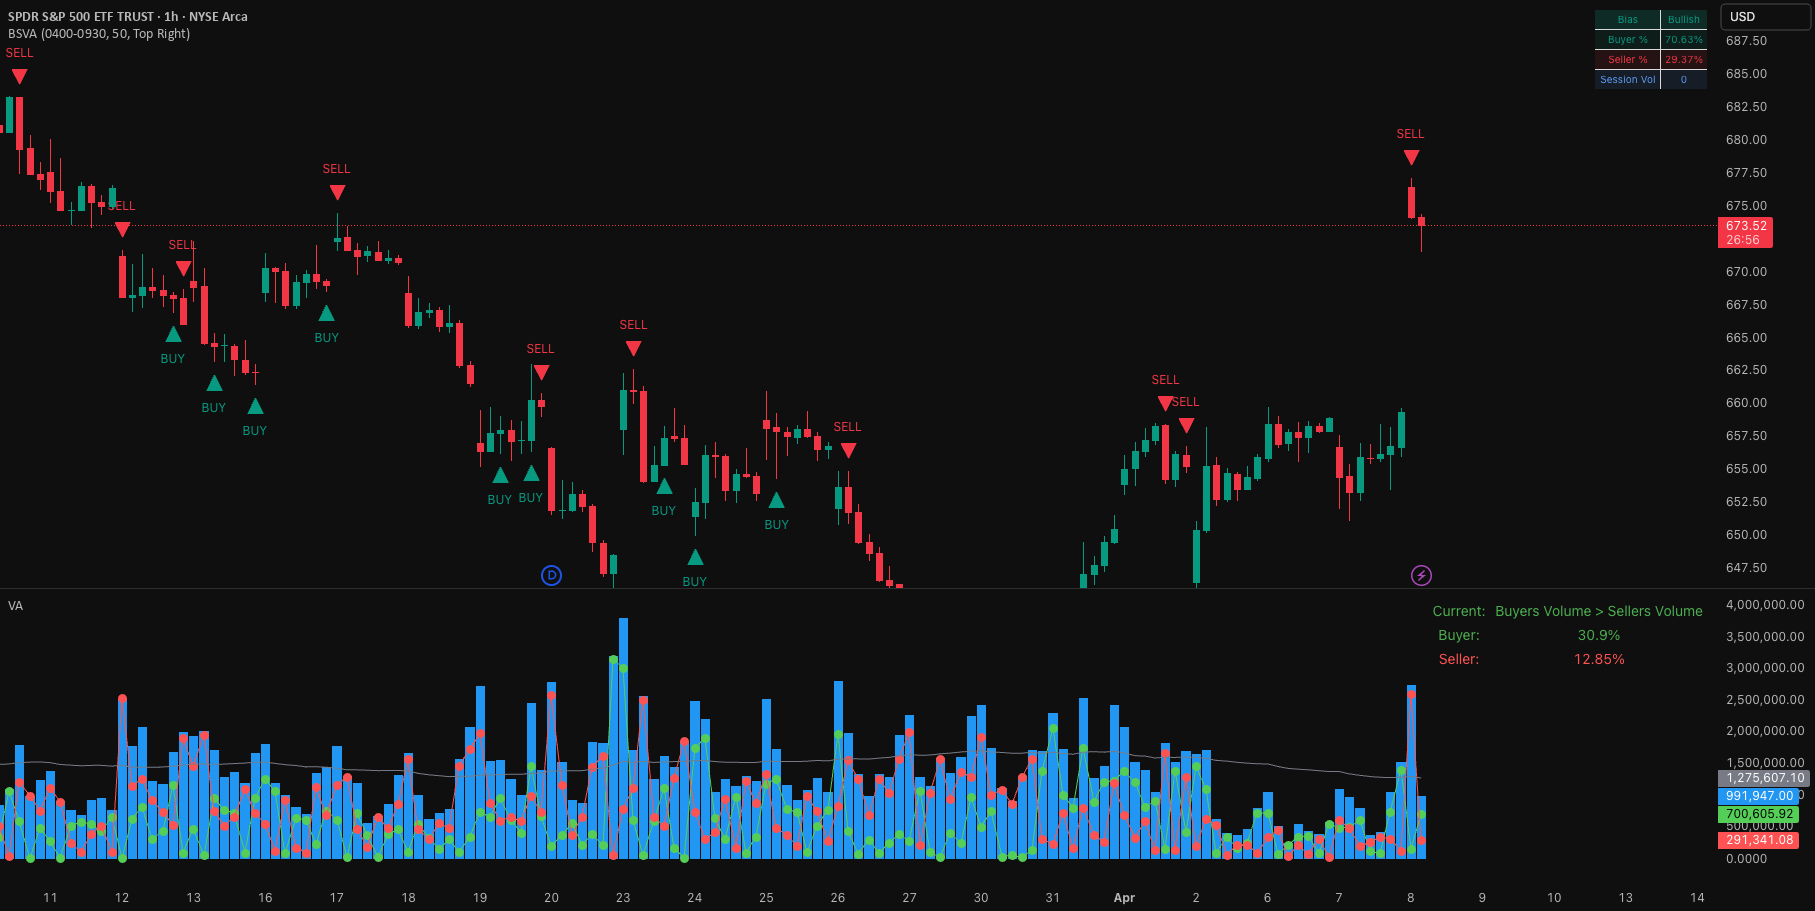
This script is designed to give a simple view of bar-level volume pressure without leaving the main chart. It estimates how much of each bar's volume belongs to buyers and sellers based on the candle's position inside its high-low range, then compares those two values to detect shifts in short-term control.
It also tracks cumulative volume inside a user-defined session window and displays the current bias, buyer percentage, seller percentage, and session volume in a compact dashboard.
How it works
- It checks whether the current bar is inside the selected session. - It estimates buying volume from the distance between the close and the low of the bar. - It estimates selling volume from the distance between the high and the close of the bar. - It calculates an SMA of total volume to use as a confirmation filter. - A buy signal appears when estimated buying volume crosses above estimated selling volume and total volume is above the average. - A sell signal appears when estimated selling volume crosses above estimated buying volume and total volume is above the average. - The dashboard updates with the current buyer percentage, seller percentage, directional bias, and cumulative session volume.
How to use it
- Use the BUY and SELL markers as short-term participation shifts, not as standalone trade instructions. - Use the buyer and seller percentages to judge whether the current bar is closing with stronger bullish or bearish pressure. - Use session volume tracking when you want to monitor activity during a specific market window such as premarket, open, or any custom session. - Use the volume SMA filter to avoid weaker crossover signals during low-activity bars.
Limitations and notes
- Buying and selling volume in this script are estimated from candle structure. They are not true bid/ask or order flow measurements from exchange data. - The signal logic is bar-based and can change until the bar closes. - Results can vary by symbol, timeframe, and session setting. - This script is intended as a chart-reading aid, not a guarantee of future price direction or trading performance.