What this script is trying to do
A breakout-risk map that turns range pressure into directional probability and timing structure.
Traders who care less about hype and more about whether a range is actually ready to break now.
This script is designed to quantify breakout risk around a defined range (highest high / lowest low over a lookback) and express it as:
Directional breakout probabilities (Up% and Dn%), and
A hazard surface across the next Forecast Horizon bars that estimates when the breakout risk is concentrated.
It’s not a price target tool. It’s a regime/context tool: “How likely is a range break, in which direction, and is that risk near-term?”
What you can learn from the public version
The original TradingView page gives traders two useful things at once: a working example on chart and a chance to inspect real Pine work instead of only reading service copy.
The visible controls already tell you a lot. Inputs such as Public source is available directly on TradingView. make it easier to understand what the script is trying to manage in live use.
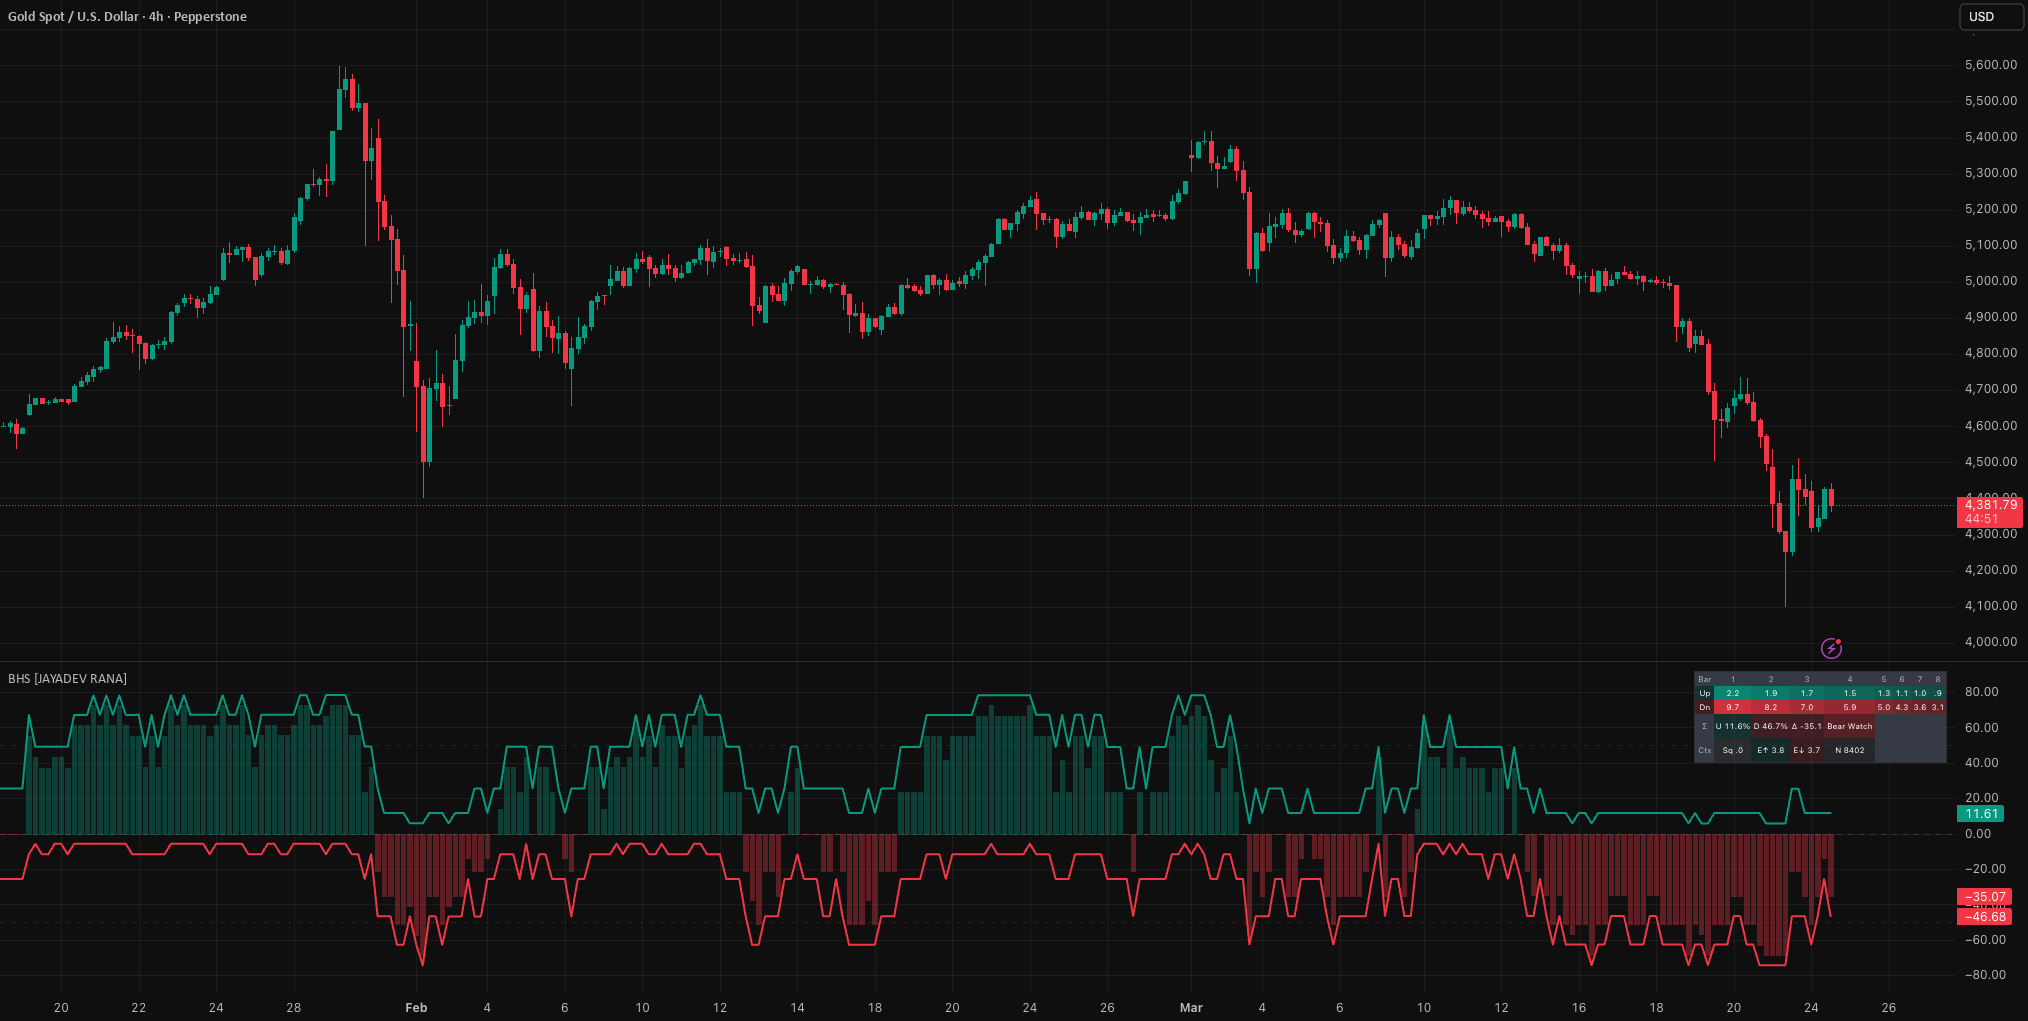
Bull Watch / Bear Watch: When one side’s breakout probability exceeds the other, but doesn’t meet the strict “expansion” trigger, the script flags a directional watch state.
Bull Expansion / Bear Expansion (signal markers): A signal prints when:
One side’s probability is dominant (≥ Dominance Threshold),
The net edge versus the opposite side is meaningful (≥ Minimum Edge), and
The expected timing is front-loaded (expected breakout bar ≤ Front-Loaded Cutoff).
Net Edge histogram: The column plot shows the difference between Up% and Dn% (in percentage points). Positive values indicate bullish skew; negative values indicate bearish skew.
Hazard Table (timing distribution): The table shows the probability mass allocated to each future bar (1…Horizon) for both directions. Higher values early in the horizon imply “pressure building now”; flatter distributions imply “risk exists but timing is less urgent.”
Engineering notes from the script
- Published as a TradingView indicator, which makes it easy for traders to inspect the logic, add it to chart, and decide whether they want a custom private version later.
- This matters because traders can inspect real public TradingView work before deciding whether they need a custom paid build.
1) Range context and proximity
The “range” is defined by Range Length: highest high and lowest low.
Proximity measures how close price is to the range high (bull) or range low (bear), normalized by range size (with ATR as a floor to avoid tiny ranges).
2) Volatility compression / expansion
Uses fast vs slow ATR (ATR Fast Length vs ATR Slow Length) to estimate compression:
Compression rises when ATR_fast is well below ATR_slow.
Expansion is treated as (1 − compression) and feeds the urgency/timing model.
3) Drift and efficiency
Drift is approximated via an EMA of log returns normalized by return stdev (Drift Length), converted into a bull/bear drift score.
Efficiency estimates directional “trend efficiency” over the drift window (net move divided by total absolute movement), assigned to bull or bear based on direction.
4) Volume normalisation
Volume is z-scored over Volume Length and mapped into a bounded 0–1 feature to avoid extreme influence.
5) Score blending → bucket calibration
A Bull Score and Bear Score are blended from proximity, drift, compression, efficiency, and volume.
Each score is discretised into Calibration Bins.
For each bin, the script records:
Trials: how often that bin occurred historically
Hits: how often an up-break (future high > past range high) or down-break (future low < past range low) occurred within the forecast horizon
Probabilities are computed with Laplace smoothing (the “Laplace Prior”) and optional Neighbor Smoothing across adjacent bins to stabilize estimates when data is sparse.
6) Hazard surface (probability by future bar)
The script takes the calibrated breakout probability (Up% / Dn%) and distributes it across the next Horizon bars using an exponential-style timing model driven by an urgency factor (proximity + drift tilt + expansion + volume tilt).
Result: you get both total probability and a timing profile (front-loaded vs back-loaded).
What this says about the way Jayadev Rana works
There is a big difference between saying you write Pine Script and publishing work people can inspect on their own charts. These open-source releases show the public side of Jayadev Rana’s work: ideas shared freely, visible chart behavior, and clear explanations around what the script is doing.
If the free version gets close to what you want but not all the way there, the useful move is to treat it as a reference point. From there, the custom build can be shaped around cleaner rules, better safeguards, broker routing, or a more production-ready workflow.
Positive Volume Index (PVI)