Snapshots
How it works
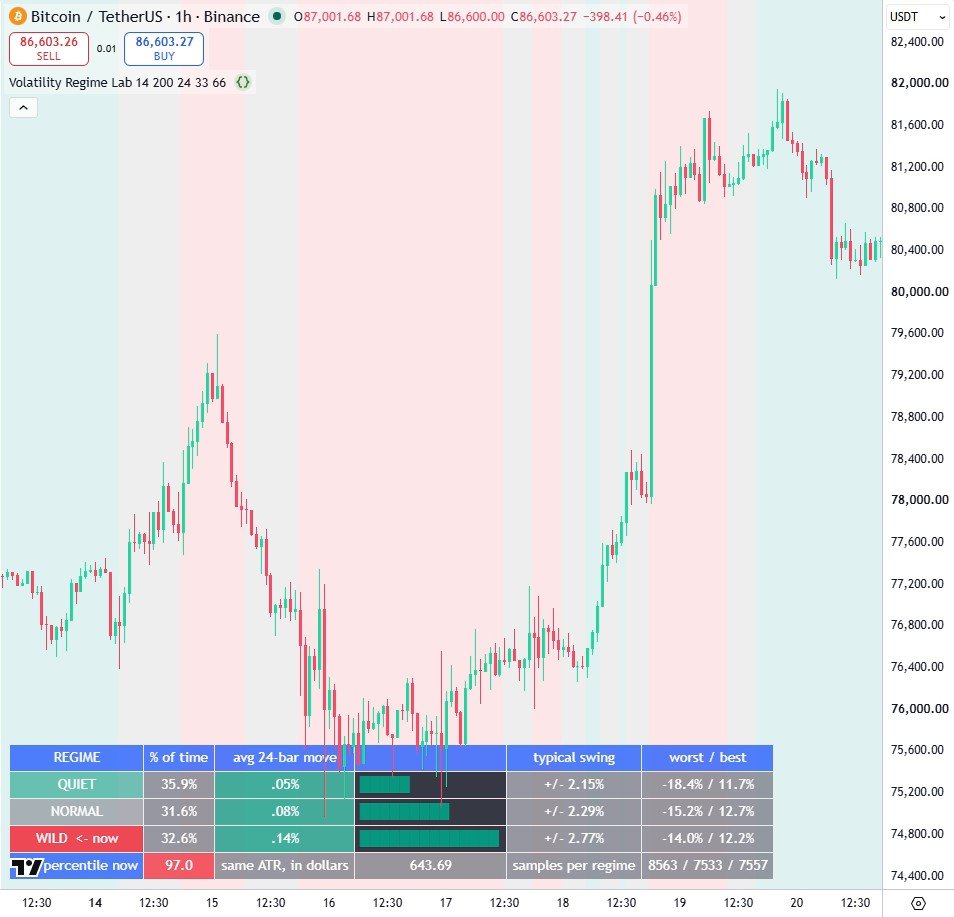
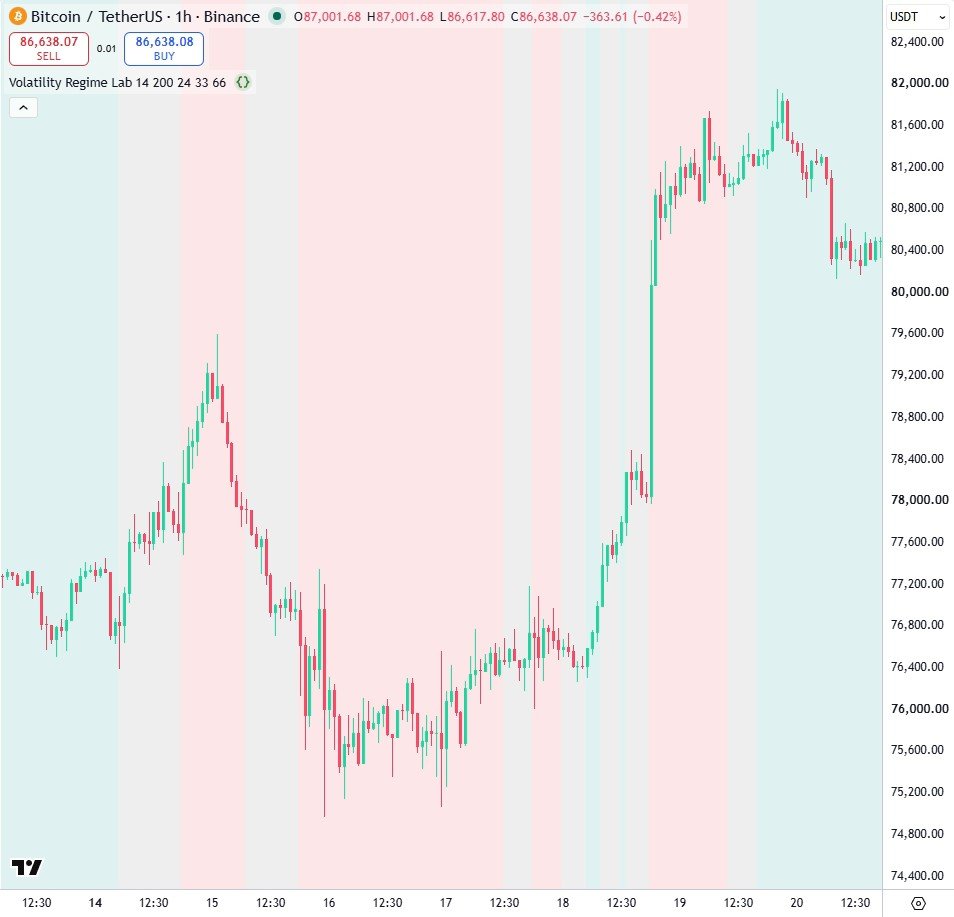
- ta.percentrank turns ATR into its own percentile, so the regime is relative to the instrument and the timeframe rather than to a dollar figure.
- The forward return is attributed to the regime the bar was in and measured on closed data only, so nothing repaints.
- Counts, means, best and worst are accumulated per regime in arrays, which is what the table reports.
Settings
| Setting | Default | What it does |
|---|---|---|
| ATR length | 14 | Bars used for the ATR |
| Bars used to rank today's volatility | 200 | History the ATR percentile is ranked against |
| Forward return measured over N bars | 24 | How far ahead each regime's outcome is measured |
| Quiet below this percentile | 33 | ATR percentile under which the market counts as quiet |
| Wild above this percentile | 66 | ATR percentile over which the market counts as wild |
| Shade the background by regime | true | Tints the chart by regime state |
Source code
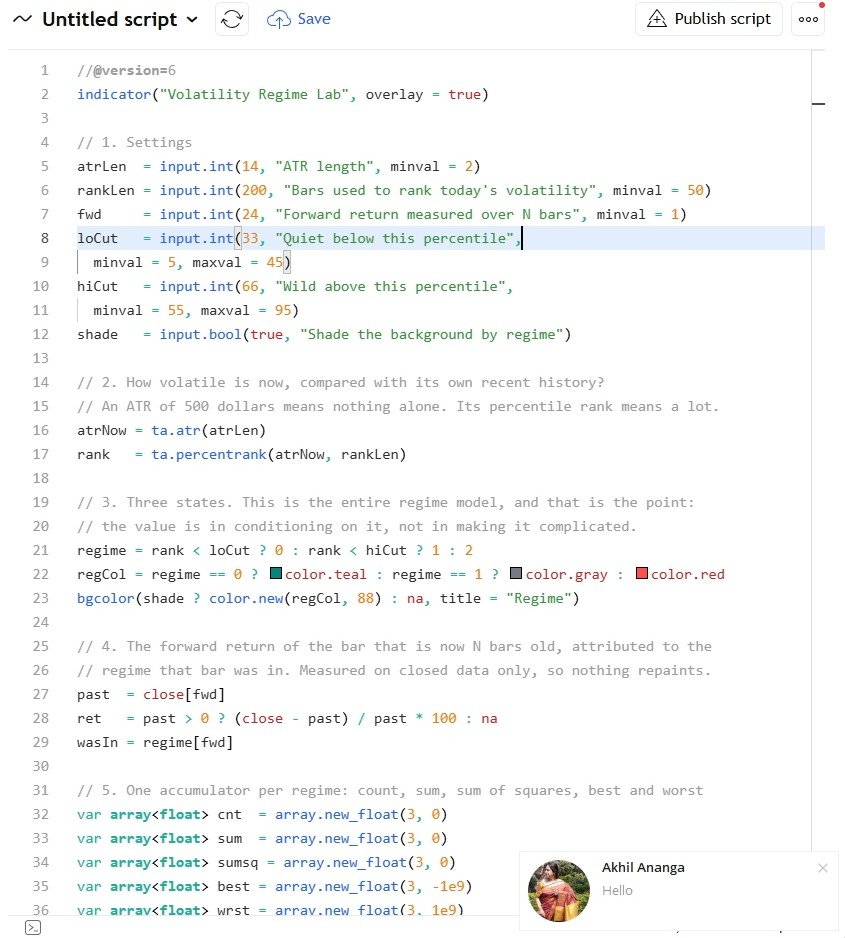
In TradingView: open the Pine Editor, create a new indicator, paste the code, then click "Add to chart".
//@version=6
indicator("Volatility Regime Lab", overlay = true)

// 1. Settings
atrLen  = input.int(14, "ATR length", minval = 2)
rankLen = input.int(200, "Bars used to rank today's volatility", minval = 50)
fwd     = input.int(24, "Forward return measured over N bars", minval = 1)
loCut   = input.int(33, "Quiet below this percentile",
  minval = 5, maxval = 45)
hiCut   = input.int(66, "Wild above this percentile",
  minval = 55, maxval = 95)
shade   = input.bool(true, "Shade the background by regime")

// 2. How volatile is now, compared with its own recent history?
// An ATR of 500 dollars means nothing alone. Its percentile rank means a lot.
atrNow = ta.atr(atrLen)
rank   = ta.percentrank(atrNow, rankLen)

// 3. Three states. This is the entire regime model, and that is the point:
// the value is in conditioning on it, not in making it complicated.
regime = rank < loCut ? 0 : rank < hiCut ? 1 : 2
regCol = regime == 0 ? color.teal : regime == 1 ? color.gray : color.red
bgcolor(shade ? color.new(regCol, 88) : na, title = "Regime")

// 4. The forward return of the bar that is now N bars old, attributed to the
// regime that bar was in. Measured on closed data only, so nothing repaints.
past  = close[fwd]
ret   = past > 0 ? (close - past) / past * 100 : na
wasIn = regime[fwd]

// 5. One accumulator per regime: count, sum, sum of squares, best and worst
var array<float> cnt  = array.new_float(3, 0)
var array<float> sum  = array.new_float(3, 0)
var array<float> sumsq = array.new_float(3, 0)
var array<float> best = array.new_float(3, -1e9)
var array<float> wrst = array.new_float(3, 1e9)
var array<float> bars = array.new_float(3, 0)
if not na(regime)
    array.set(bars, regime, array.get(bars, regime) + 1)
if not na(ret) and not na(wasIn) and bar_index > rankLen + fwd
    array.set(cnt,  wasIn, array.get(cnt,  wasIn) + 1)
    array.set(sum,  wasIn, array.get(sum,  wasIn) + ret)
    array.set(sumsq, wasIn, array.get(sumsq, wasIn) + ret * ret)
    array.set(best, wasIn, math.max(array.get(best, wasIn), ret))
    array.set(wrst, wasIn, math.min(array.get(wrst, wasIn), ret))

// 6. The table, and a bar drawn out of block characters
var table t = table.new(position.bottom_left, 6, 5, border_width = 1)
head(c, s) =>
    table.cell(t, c, 0, s, text_color = color.white, text_size = size.normal,
      bgcolor = color.new(color.blue, 20))
put(c, r, s, bg) =>
    table.cell(t, c, r, s, text_color = color.white, text_size = size.normal,
      bgcolor = bg)
bar(v, pk) =>
    w = int(math.round(14.0 * math.abs(v) / math.max(pk, 0.0001)))
    s = ""
    // a Pine for-loop with a start above its end counts DOWNWARDS,
    // so an empty bin would print two blocks instead of none
    if w > 0
        for i = 1 to w
            s += "█"
    s

// 7. Report, on the last bar
if barstate.islast
    total = array.sum(bars)
    names = array.from("QUIET", "NORMAL", "WILD")
    cols  = array.from(color.teal, color.gray, color.red)
    // the biggest average move, so the bars can share a scale
    pk = 0.0
    for i = 0 to 2
        n = array.get(cnt, i)
        if n > 0
            pk := math.max(pk, math.abs(array.get(sum, i) / n))
    head(0, "REGIME")
    head(1, "% of time")
    head(2, "avg " + str.tostring(fwd) + "-bar move")
    head(3, "")
    head(4, "typical swing")
    head(5, "worst / best")
    for i = 0 to 2
        n    = array.get(cnt, i)
        avg  = n > 0 ? array.get(sum, i) / n : 0.0
        varc = n > 0 ? array.get(sumsq, i) / n - avg * avg : 0.0
        sd   = math.sqrt(math.max(varc, 0))
        share = 100.0 * array.get(bars, i) / math.max(total, 1)
        live = regime == i
        put(0, i + 1, array.get(names, i) + (live ? "  <- now" : ""),
          color.new(array.get(cols, i), live ? 10 : 45))
        put(1, i + 1, str.tostring(share, "#.0") + "%", color.new(color.gray, 25))
        put(2, i + 1, str.tostring(avg, "#.00") + "%",
          avg >= 0 ? color.new(color.teal, 25) : color.new(color.red, 25))
        table.cell(t, 3, i + 1, bar(avg, pk),
          text_color = avg >= 0 ? color.teal : color.red,
          bgcolor = color.new(color.black, 0), text_halign = text.align_left,
          text_size = size.normal)
        put(4, i + 1, "+/- " + str.tostring(sd, "#.00") + "%",
          color.new(color.gray, 25))
        put(5, i + 1, str.tostring(array.get(wrst, i), "#.0") + "% / " +
          str.tostring(array.get(best, i), "#.0") + "%", color.new(color.gray, 25))
    put(0, 4, "ATR percentile now", color.new(color.blue, 20))
    put(1, 4, str.tostring(rank, "#.0"), color.new(regCol, 20))
    put(2, 4, "same ATR, in dollars", color.new(color.gray, 25))
    put(3, 4, str.tostring(atrNow, format.mintick), color.new(color.gray, 25))
    put(4, 4, "samples per regime", color.new(color.gray, 25))
    put(5, 4, str.tostring(array.get(cnt, 0), "#") + " / " +
      str.tostring(array.get(cnt, 1), "#") + " / " +
      str.tostring(array.get(cnt, 2), "#"), color.new(color.gray, 25))

// 8. Alerts on a regime change, which is usually what you actually want to know
alertcondition(regime != regime[1] and regime == 2, "Entered wild volatility",
  "{{ticker}} volatility regime is now WILD")
alertcondition(regime != regime[1] and regime == 0, "Entered quiet volatility",
  "{{ticker}} volatility regime is now QUIET")
Watch it built
This script is written and explained step by step in the video lesson.
Need a custom indicator or strategy?
Non-repainting Pine Script v6, backtested with real costs, alert and webhook ready. Fixed quote within 24 hours.