Snapshots
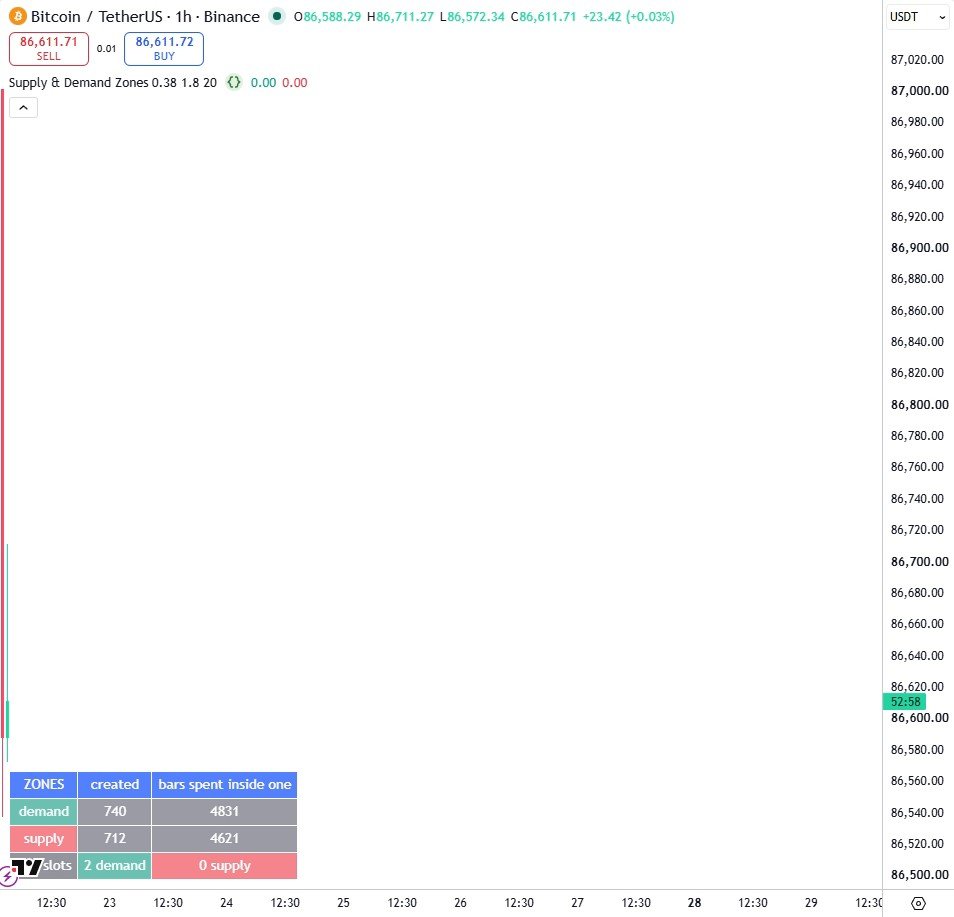
How it works
- A base candle is indecision stated as arithmetic: body divided by range, below a threshold you set.
- A zone is born when an impulse candle leaves a base behind, which is the 'institutional order block' idea without the mystique.
- Three slots per side are held in arrays as a ring buffer, so the script keeps state without drawing objects and works where drawings do not render.
Settings
| Setting | Default | What it does |
|---|---|---|
| A base candle's body, as a share of its range | 0.38 | How small a body must be to count as indecision |
| An impulse body must beat the average body by | 1.8 | How much bigger than average an impulse must be |
| Bars used for the average body | 20 | History used for the average body size |
| Keep zones on the chart after they are used | false | Leaves spent zones visible instead of removing them |
Source code
In TradingView: open the Pine Editor, create a new indicator, paste the code, then click "Add to chart".
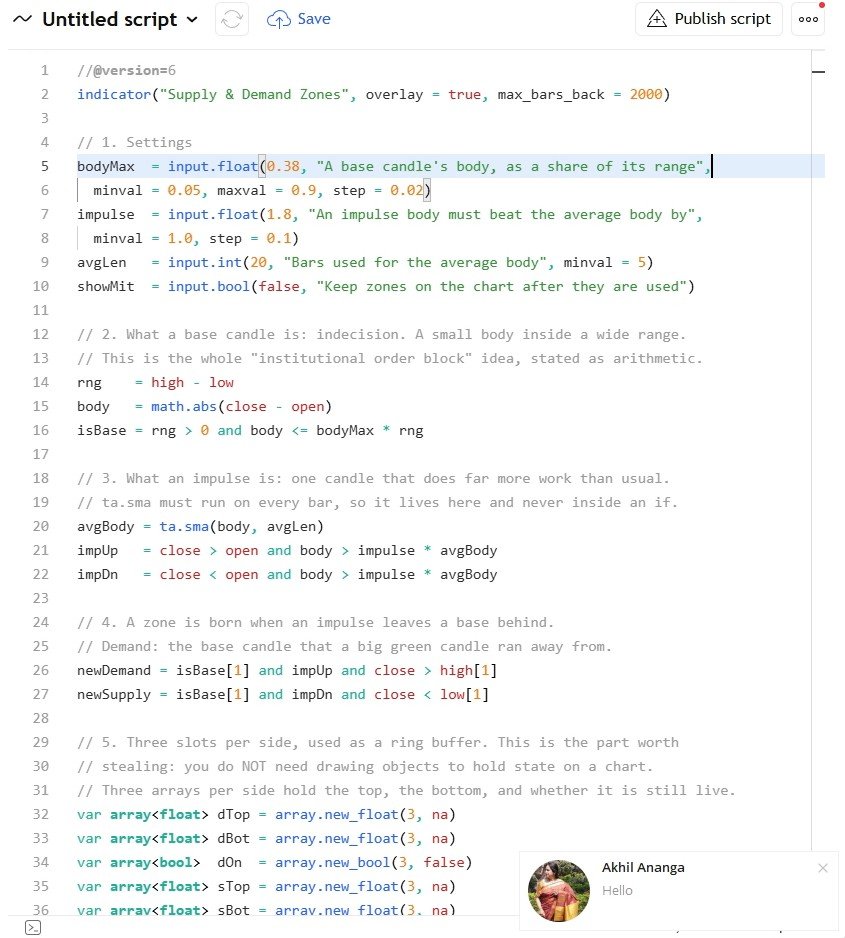
//@version=6
indicator("Supply & Demand Zones", overlay = true, max_bars_back = 2000)

// 1. Settings
bodyMax  = input.float(0.38, "A base candle's body, as a share of its range",
  minval = 0.05, maxval = 0.9, step = 0.02)
impulse  = input.float(1.8, "An impulse body must beat the average body by",
  minval = 1.0, step = 0.1)
avgLen   = input.int(20, "Bars used for the average body", minval = 5)
showMit  = input.bool(false, "Keep zones on the chart after they are used")

// 2. What a base candle is: indecision. A small body inside a wide range.
// This is the whole "institutional order block" idea, stated as arithmetic.
rng    = high - low
body   = math.abs(close - open)
isBase = rng > 0 and body <= bodyMax * rng

// 3. What an impulse is: one candle that does far more work than usual.
// ta.sma must run on every bar, so it lives here and never inside an if.
avgBody = ta.sma(body, avgLen)
impUp   = close > open and body > impulse * avgBody
impDn   = close < open and body > impulse * avgBody

// 4. A zone is born when an impulse leaves a base behind.
// Demand: the base candle that a big green candle ran away from.
newDemand = isBase[1] and impUp and close > high[1]
newSupply = isBase[1] and impDn and close < low[1]

// 5. Three slots per side, used as a ring buffer. This is the part worth
// stealing: you do NOT need drawing objects to hold state on a chart.
// Three arrays per side hold the top, the bottom, and whether it is still live.
var array<float> dTop = array.new_float(3, na)
var array<float> dBot = array.new_float(3, na)
var array<bool>  dOn  = array.new_bool(3, false)
var array<float> sTop = array.new_float(3, na)
var array<float> sBot = array.new_float(3, na)
var array<bool>  sOn  = array.new_bool(3, false)
var int dNext = 0
var int sNext = 0
// the bar each slot was last written on: a plot must BREAK there, otherwise it
// draws a diagonal from the old zone's level straight to the new one
var array<int> dBorn = array.new_int(3, -1)
var array<int> sBorn = array.new_int(3, -1)

// 6. Writing a new zone into the next slot, overwriting the oldest one
if newDemand
    array.set(dTop, dNext, high[1])
    array.set(dBot, dNext, low[1])
    array.set(dOn,  dNext, true)
    array.set(dBorn, dNext, bar_index)
    dNext := (dNext + 1) % 3
if newSupply
    array.set(sTop, sNext, high[1])
    array.set(sBot, sNext, low[1])
    array.set(sOn,  sNext, true)
    array.set(sBorn, sNext, bar_index)
    sNext := (sNext + 1) % 3

// 7. Mitigation: a zone dies when price trades through it. A demand zone that
// price has closed below is not demand any more, whatever it was called.
for i = 0 to 2
    if array.get(dOn, i) and close < array.get(dBot, i)
        array.set(dOn, i, showMit)
    if array.get(sOn, i) and close > array.get(sTop, i)
        array.set(sOn, i, showMit)

// 8. Turning a slot into something plottable. A plot needs a value on every
// bar, so an inactive slot returns na and the line simply stops.
lvl(vals, live, born, i) =>
    array.get(live, i) and array.get(born, i) != bar_index ?
      array.get(vals, i) : na
d0t = lvl(dTop, dOn, dBorn, 0)
d0b = lvl(dBot, dOn, dBorn, 0)
d1t = lvl(dTop, dOn, dBorn, 1)
d1b = lvl(dBot, dOn, dBorn, 1)
d2t = lvl(dTop, dOn, dBorn, 2)
d2b = lvl(dBot, dOn, dBorn, 2)
s0t = lvl(sTop, sOn, sBorn, 0)
s0b = lvl(sBot, sOn, sBorn, 0)
s1t = lvl(sTop, sOn, sBorn, 1)
s1b = lvl(sBot, sOn, sBorn, 1)
s2t = lvl(sTop, sOn, sBorn, 2)
s2b = lvl(sBot, sOn, sBorn, 2)

// 9. Six pairs of plots, and a fill between each pair. The fill IS the zone.
// It is drawn by the chart engine, so it stays crisp at every zoom level.
DG = color.new(color.teal, 55)
// linebr: an na gap breaks the line instead of bridging it.
// display.pane: keep twelve zone labels off the price scale.
SG = color.new(color.red, 55)
pd0t = plot(d0t, "Demand 1 top", DG,
  style = plot.style_linebr, display = display.pane)
pd0b = plot(d0b, "Demand 1 base", DG,
  style = plot.style_linebr, display = display.pane)
pd1t = plot(d1t, "Demand 2 top", DG,
  style = plot.style_linebr, display = display.pane)
pd1b = plot(d1b, "Demand 2 base", DG,
  style = plot.style_linebr, display = display.pane)
pd2t = plot(d2t, "Demand 3 top", DG,
  style = plot.style_linebr, display = display.pane)
pd2b = plot(d2b, "Demand 3 base", DG,
  style = plot.style_linebr, display = display.pane)
ps0t = plot(s0t, "Supply 1 top", SG,
  style = plot.style_linebr, display = display.pane)
ps0b = plot(s0b, "Supply 1 base", SG,
  style = plot.style_linebr, display = display.pane)
ps1t = plot(s1t, "Supply 2 top", SG,
  style = plot.style_linebr, display = display.pane)
ps1b = plot(s1b, "Supply 2 base", SG,
  style = plot.style_linebr, display = display.pane)
ps2t = plot(s2t, "Supply 3 top", SG,
  style = plot.style_linebr, display = display.pane)
ps2b = plot(s2b, "Supply 3 base", SG,
  style = plot.style_linebr, display = display.pane)
fill(pd0t, pd0b, color.new(color.teal, 82), "Demand 1")
fill(pd1t, pd1b, color.new(color.teal, 82), "Demand 2")
fill(pd2t, pd2b, color.new(color.teal, 82), "Demand 3")
fill(ps0t, ps0b, color.new(color.red, 82), "Supply 1")
fill(ps1t, ps1b, color.new(color.red, 82), "Supply 2")
fill(ps2t, ps2b, color.new(color.red, 82), "Supply 3")

// 10. Mark the candle that created each zone, so the rule is visible
plotshape(newDemand, "New demand", shape.triangleup, location.belowbar,
  color.teal, size = size.tiny)
plotshape(newSupply, "New supply", shape.triangledown, location.abovebar,
  color.red, size = size.tiny)

// 11. Count what the rule actually produced, and how often it held.
// An honest zone indicator reports its own hit rate.
var int madeD = 0
var int madeS = 0
var int heldD = 0
var int heldS = 0
if newDemand
    madeD += 1
if newSupply
    madeS += 1
for i = 0 to 2
    inD = array.get(dOn, i) and low <= array.get(dTop, i) and
      close > array.get(dBot, i)
    inS = array.get(sOn, i) and high >= array.get(sBot, i) and
      close < array.get(sTop, i)
    if inD
        heldD += 1
    if inS
        heldS += 1

// 12. The scoreboard
var table t = table.new(position.bottom_left, 3, 4, border_width = 1)
put(c, r, txt, bg) =>
    table.cell(t, c, r, txt, text_color = color.white, text_size = size.normal,
      bgcolor = bg)
if barstate.islast
    put(0, 0, "ZONES", color.new(color.blue, 20))
    put(1, 0, "created", color.new(color.blue, 20))
    put(2, 0, "bars spent inside one", color.new(color.blue, 20))
    put(0, 1, "demand", color.new(color.teal, 40))
    put(1, 1, str.tostring(madeD), color.new(color.gray, 25))
    put(2, 1, str.tostring(heldD), color.new(color.gray, 25))
    put(0, 2, "supply", color.new(color.red, 40))
    put(1, 2, str.tostring(madeS), color.new(color.gray, 25))
    put(2, 2, str.tostring(heldS), color.new(color.gray, 25))
    put(0, 3, "live slots", color.new(color.gray, 20))
    put(1, 3, str.tostring((array.get(dOn, 0) ? 1 : 0) +
      (array.get(dOn, 1) ? 1 : 0) + (array.get(dOn, 2) ? 1 : 0)) + " demand",
      color.new(color.teal, 40))
    put(2, 3, str.tostring((array.get(sOn, 0) ? 1 : 0) +
      (array.get(sOn, 1) ? 1 : 0) + (array.get(sOn, 2) ? 1 : 0)) + " supply",
      color.new(color.red, 40))
Watch it built
This script is written and explained step by step in the video lesson.
Need a custom indicator or strategy?
Non-repainting Pine Script v6, backtested with real costs, alert and webhook ready. Fixed quote within 24 hours.