Snapshots
How it works
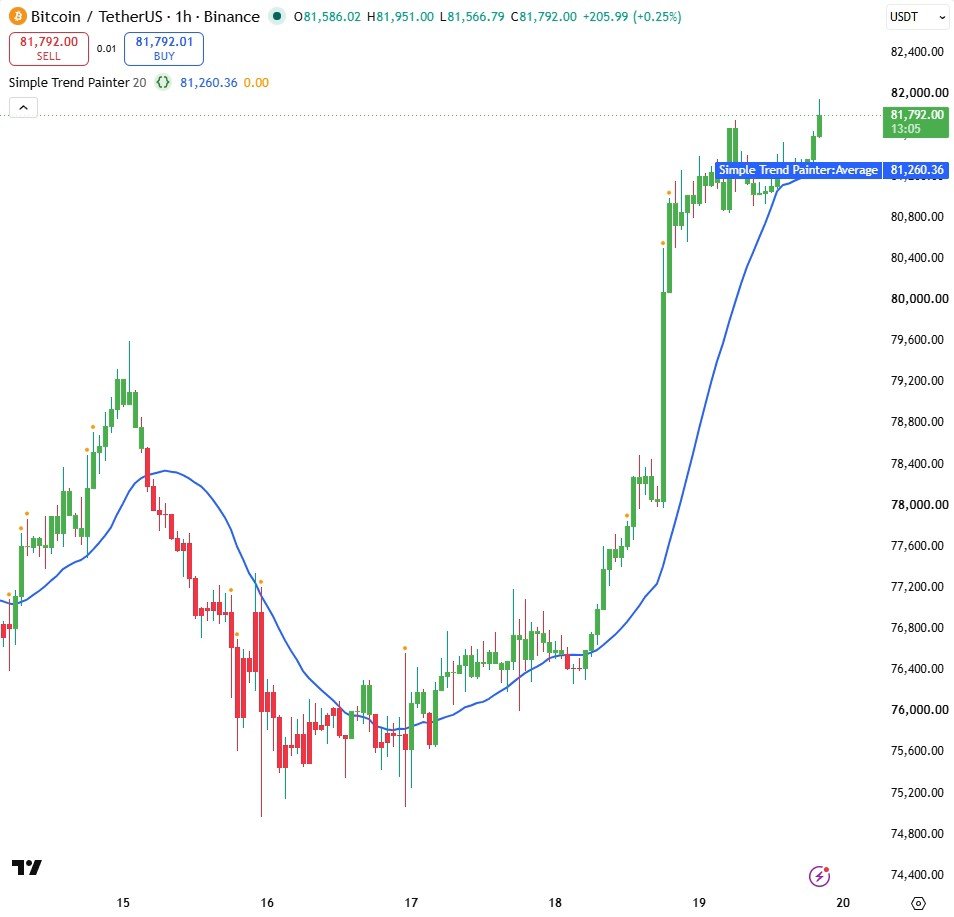
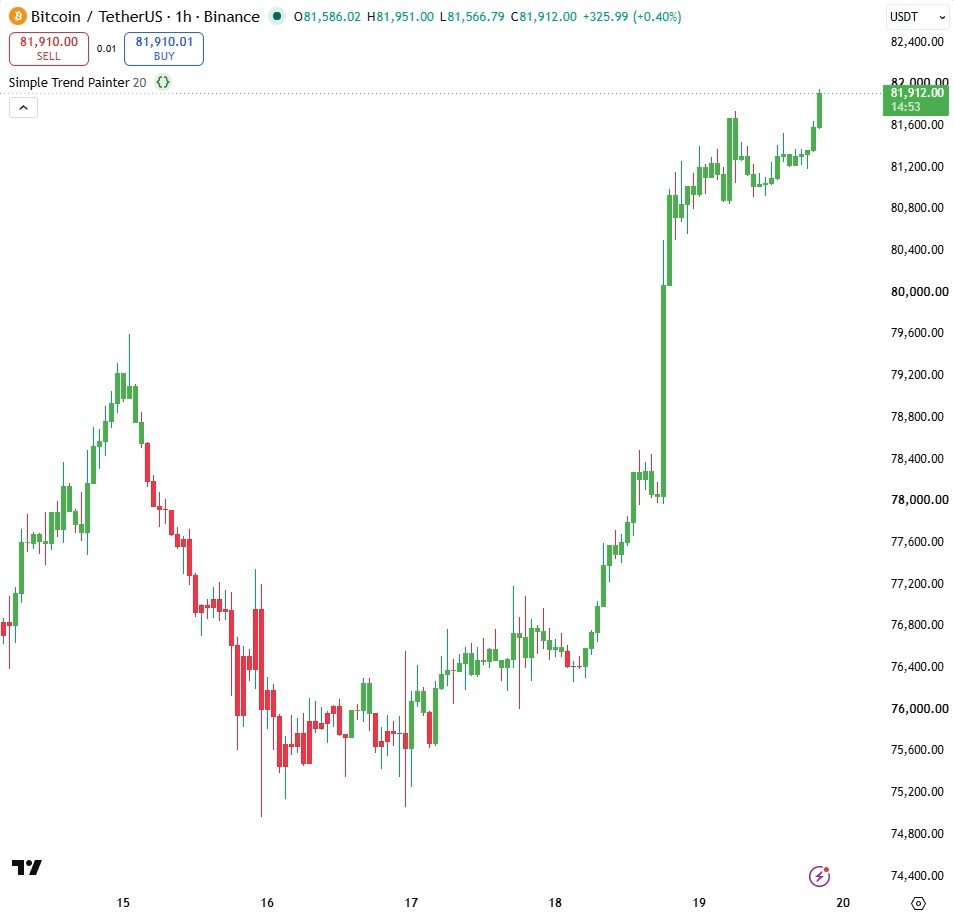
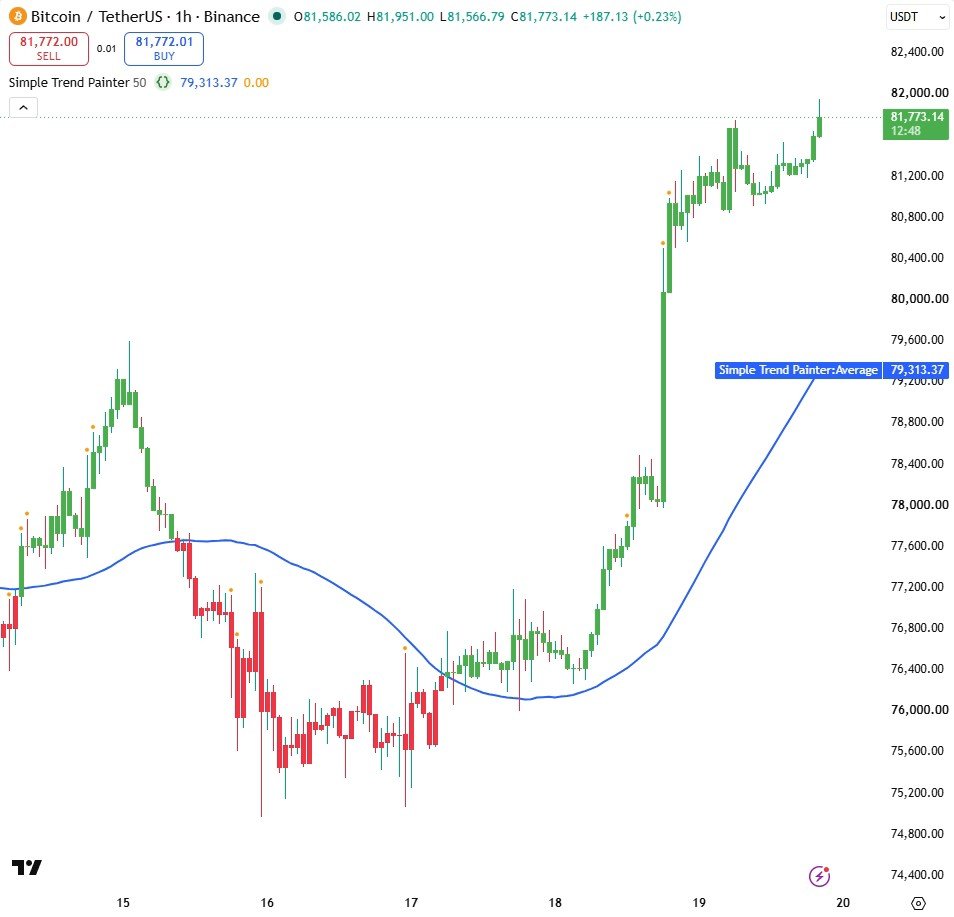
- barcolor paints every candle green when the close is above the moving average and red when it is below.
- An orange circle marks candles whose volume is more than twice the 20-candle average volume.
- Create an alert on "Simple Trend Painter" and pick "Price crossed average".
Settings
| Setting | Default | What it does |
|---|---|---|
| Average length | 20 | How many candles the moving average uses |
Source code
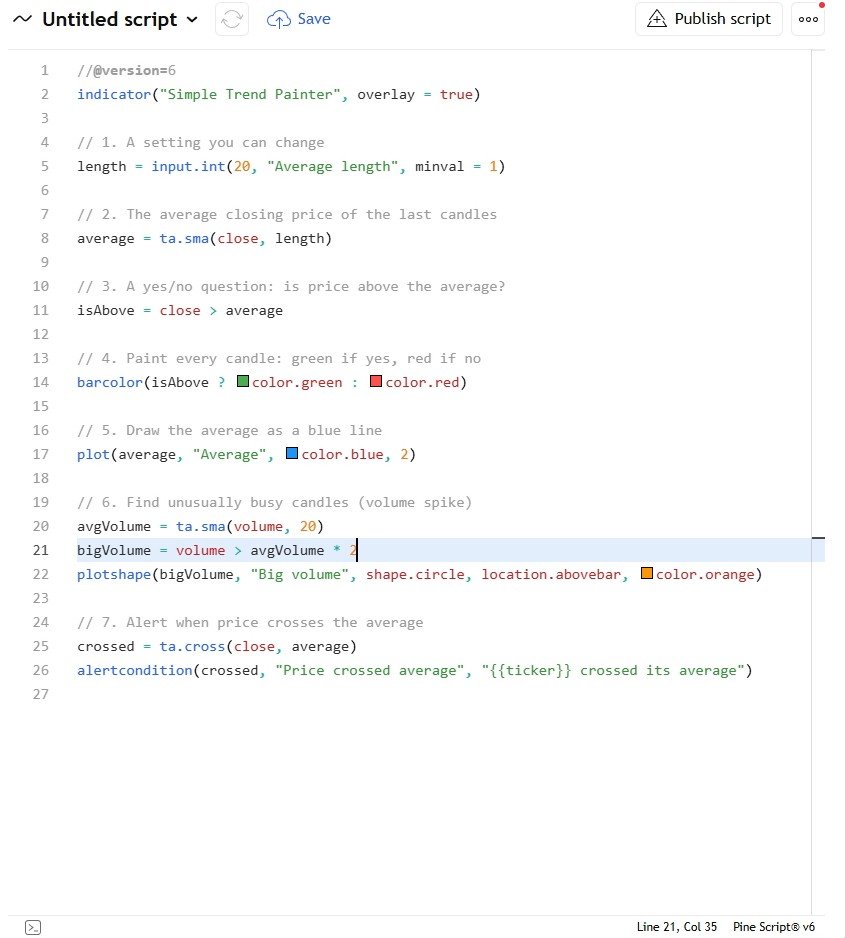
In TradingView: open the Pine Editor, create a new indicator, paste the code, then click "Add to chart".
//@version=6
indicator("Simple Trend Painter", overlay = true)

// 1. A setting you can change
length = input.int(20, "Average length", minval = 1)

// 2. The average closing price of the last candles
average = ta.sma(close, length)

// 3. A yes/no question: is price above the average?
isAbove = close > average

// 4. Paint every candle: green if yes, red if no
barcolor(isAbove ? color.green : color.red)

// 5. Draw the average as a blue line
plot(average, "Average", color.blue, 2)

// 6. Find unusually busy candles (volume spike)
avgVolume = ta.sma(volume, 20)
bigVolume = volume > avgVolume * 2
plotshape(bigVolume, "Big volume", shape.circle, location.abovebar, color.orange)

// 7. Alert when price crosses the average
crossed = ta.cross(close, average)
alertcondition(crossed, "Price crossed average", "{{ticker}} crossed its average")
Watch it built
This script is written and explained step by step in the video lesson.
Need a custom indicator or strategy?
Non-repainting Pine Script v6, backtested with real costs, alert and webhook ready. Fixed quote within 24 hours.