Snapshots
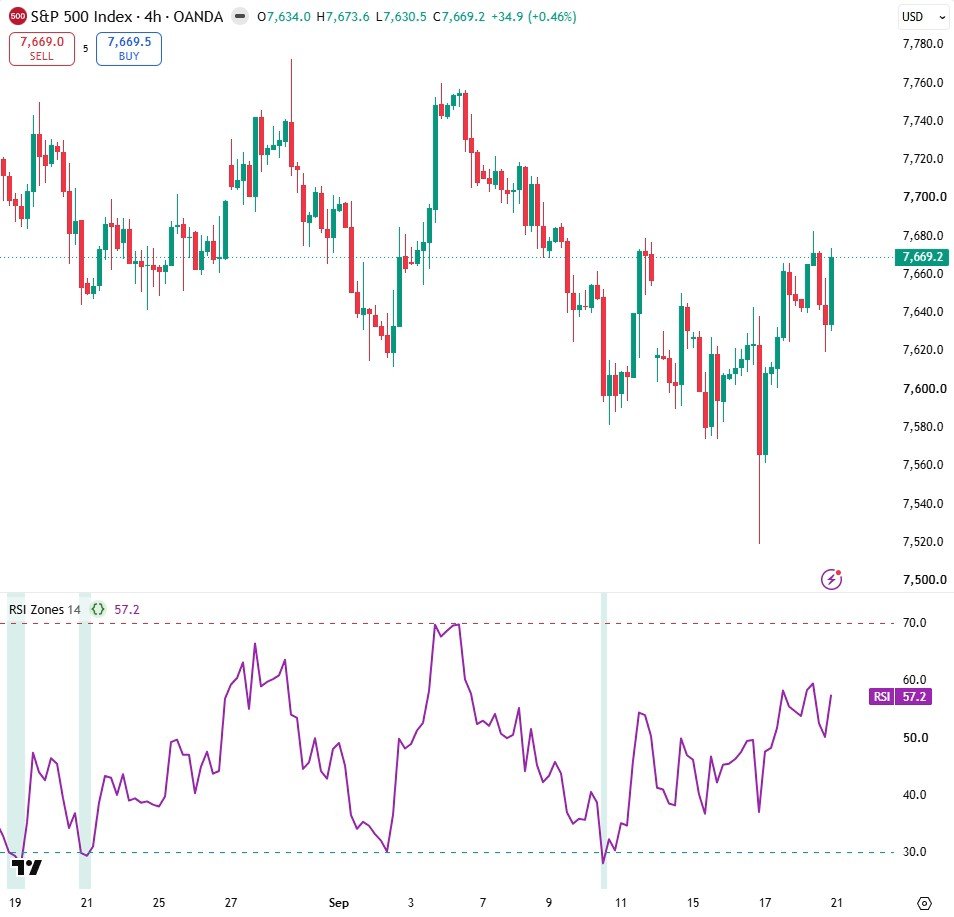
How it works
- overlay = false puts the RSI in its own pane under the price chart.
- The background shading uses a nested ternary: red above 70, teal below 30, no colour (na) otherwise.
- Change the RSI length in the indicator settings; 14 is the classic default.
Settings
| Setting | Default | What it does |
|---|---|---|
| RSI Length | 14 | Look-back of the RSI calculation |
Source code
In TradingView: open the Pine Editor, create a new indicator, paste the code, then click "Add to chart".
//@version=6
indicator("RSI Zones", overlay = false)

len = input.int(14, "RSI Length", minval = 2)
r   = ta.rsi(close, len)

plot(r, "RSI", color.purple, 2)
hline(70, "Overbought", color.red)
hline(30, "Oversold", color.teal)
bgcolor(r > 70 ? color.new(color.red, 85) : r < 30 ? color.new(color.teal, 85) : na)
Watch it built
This script is written line by line in the TradingView Masterclass video.
Need a custom indicator or strategy?
Non-repainting Pine Script v6, backtested with real costs, alert and webhook ready. Fixed quote within 24 hours.