Snapshots
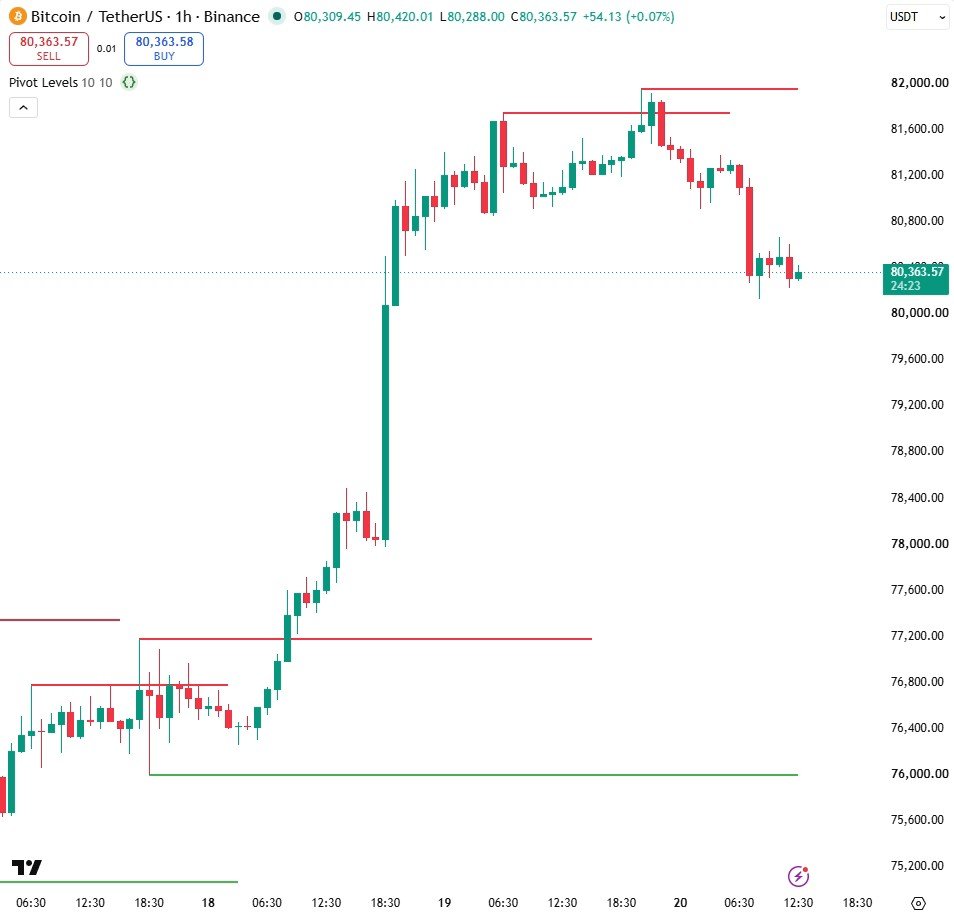
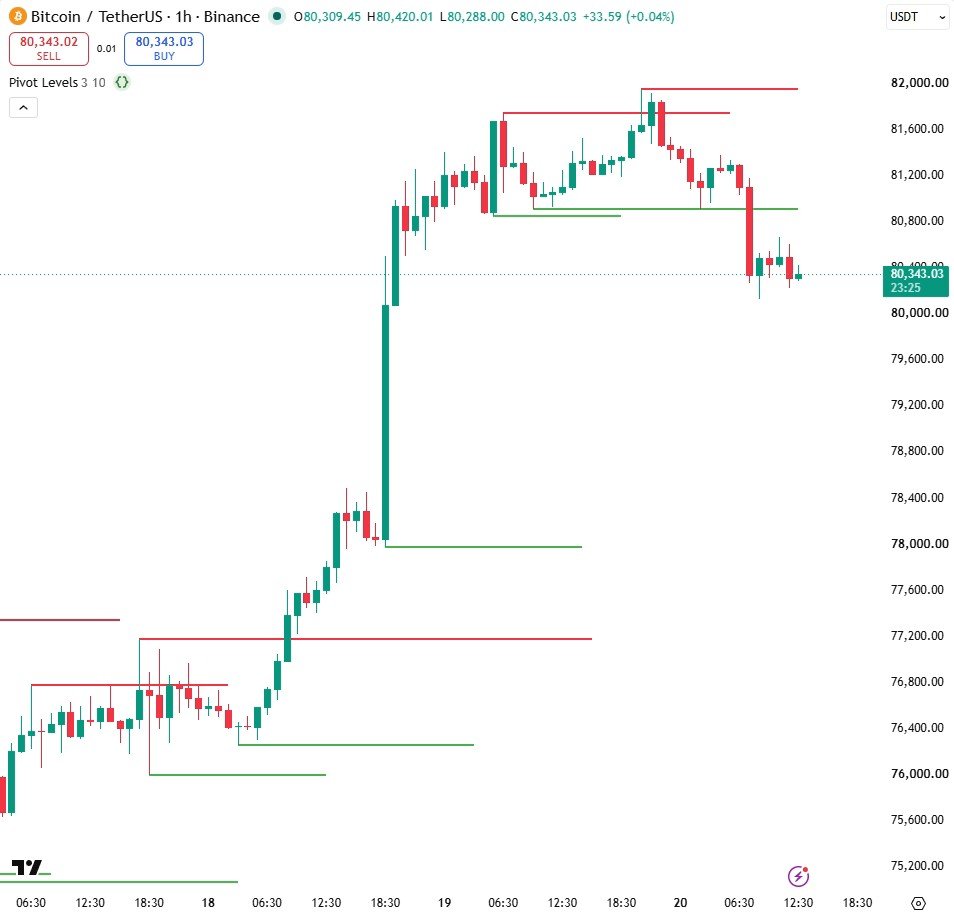
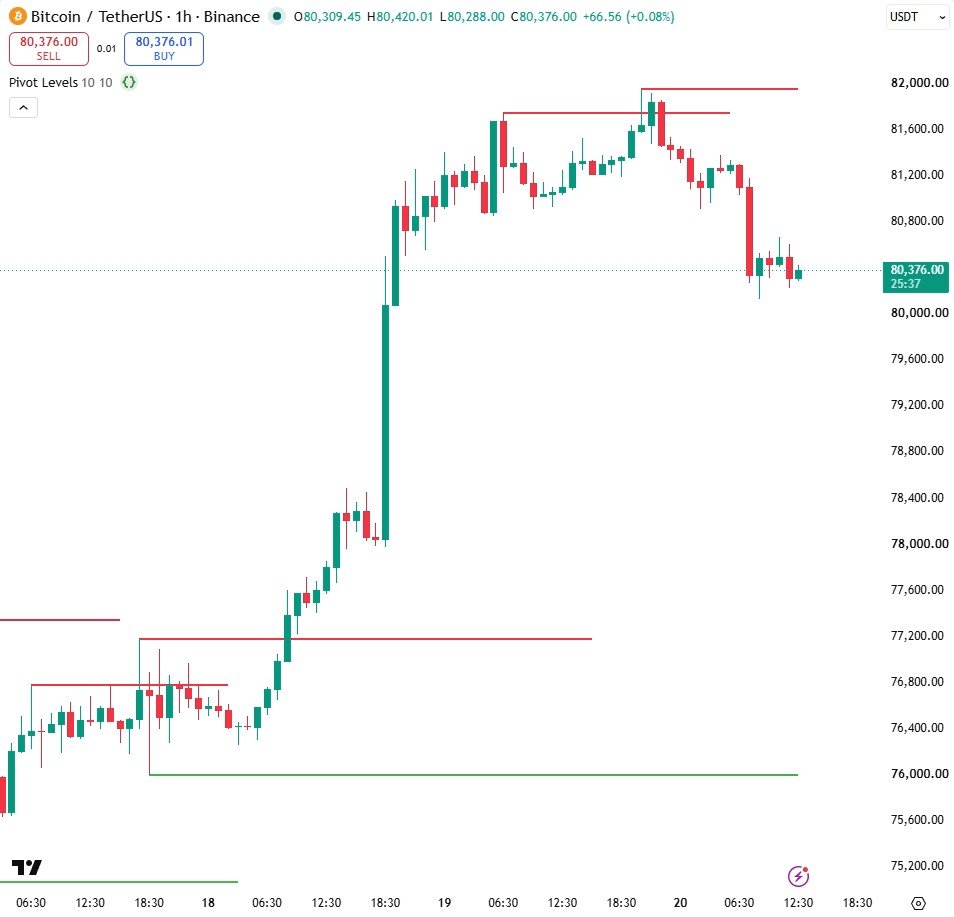
How it works
- ta.pivothigh and ta.pivotlow find a candle that is higher (or lower) than the chosen number of candles on both sides.
- A level is only confirmed after the right-hand candles exist, so it appears a few candles late. That is honest, not a bug.
- line.set_x2 stretches the newest support and resistance to the current candle on every bar.
Settings
| Setting | Default | What it does |
|---|---|---|
| Candles to the left | 10 | How many candles must be lower on the left |
| Candles to the right | 10 | How many must be lower on the right (this is the confirmation delay) |
| Draw the levels | true | Switch the drawing off without removing the script |
Source code
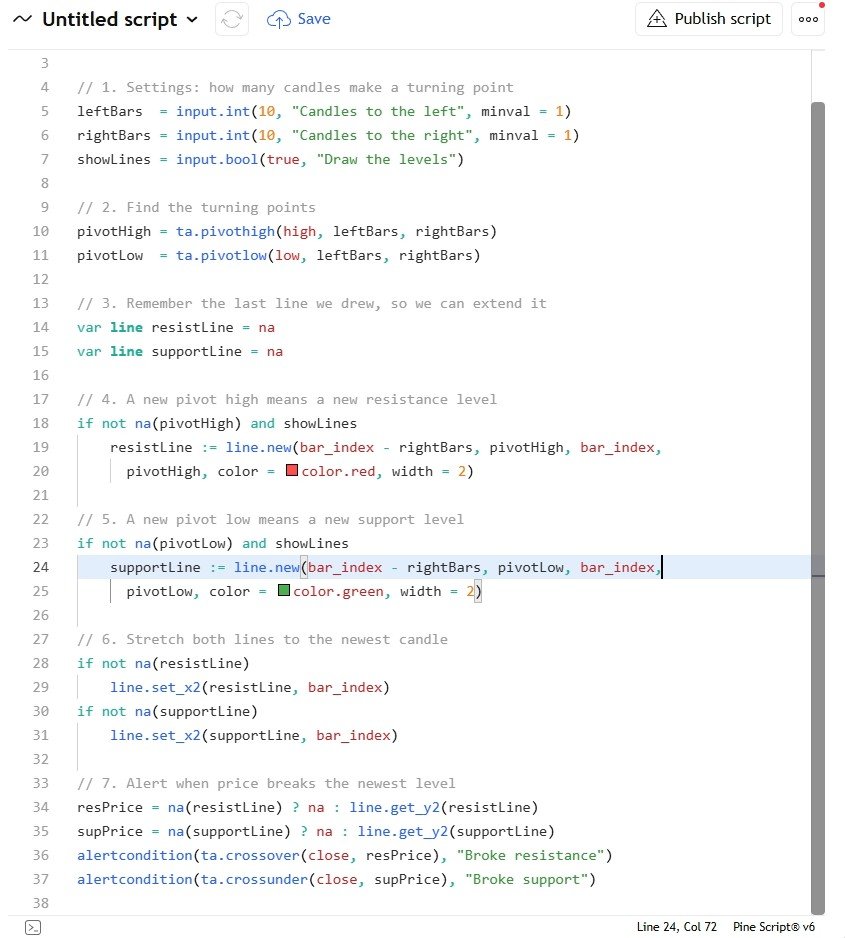
In TradingView: open the Pine Editor, create a new indicator, paste the code, then click "Add to chart".
//@version=6
indicator("Pivot Levels", overlay = true, max_lines_count = 100)

// 1. Settings: how many candles make a turning point
leftBars  = input.int(10, "Candles to the left", minval = 1)
rightBars = input.int(10, "Candles to the right", minval = 1)
showLines = input.bool(true, "Draw the levels")

// 2. Find the turning points
pivotHigh = ta.pivothigh(high, leftBars, rightBars)
pivotLow  = ta.pivotlow(low, leftBars, rightBars)

// 3. Remember the last line we drew, so we can extend it
var line resistLine = na
var line supportLine = na

// 4. A new pivot high means a new resistance level
if not na(pivotHigh) and showLines
    resistLine := line.new(bar_index - rightBars, pivotHigh, bar_index,
      pivotHigh, color = color.red, width = 2)

// 5. A new pivot low means a new support level
if not na(pivotLow) and showLines
    supportLine := line.new(bar_index - rightBars, pivotLow, bar_index,
      pivotLow, color = color.green, width = 2)

// 6. Stretch both lines to the newest candle
if not na(resistLine)
    line.set_x2(resistLine, bar_index)
if not na(supportLine)
    line.set_x2(supportLine, bar_index)

// 7. Alert when price breaks the newest level
resPrice = na(resistLine) ? na : line.get_y2(resistLine)
supPrice = na(supportLine) ? na : line.get_y2(supportLine)
alertcondition(ta.crossover(close, resPrice), "Broke resistance")
alertcondition(ta.crossunder(close, supPrice), "Broke support")
Watch it built
This script is written and explained step by step in the video lesson.
Need a custom indicator or strategy?
Non-repainting Pine Script v6, backtested with real costs, alert and webhook ready. Fixed quote within 24 hours.