Snapshots
How it works
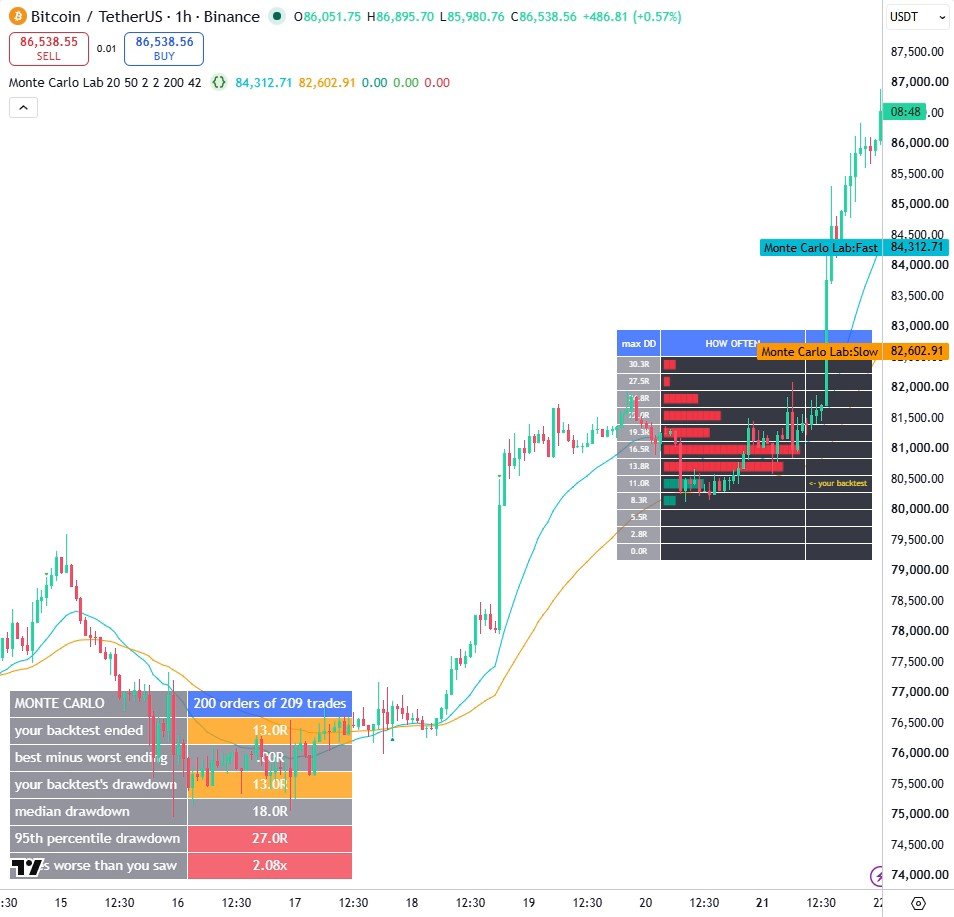
- The same R-multiple trade list is shuffled with a seeded generator, so a re-run reproduces the identical set of histories.
- Each shuffled history is walked once to record its ending and its worst drawdown, which is what the percentile rows report.
- Only the ORDER changes: the trades, the win rate and the payoff are untouched, so anything that moves is path risk, not edge.
Settings
| Setting | Default | What it does |
|---|---|---|
| Fast average | 20 | Fast moving-average length |
| Slow average | 50 | Slow moving-average length |
| Stop = ATR x | 2.0 | Stop distance, in ATRs |
| Target = R x | 2.0 | Target distance, as a multiple of the risk |
| Alternative histories to run | 200 | How many reshuffles of the same trades to simulate |
| Random seed | 42 | Fixes the shuffle, so a re-run reproduces the same result |
Source code
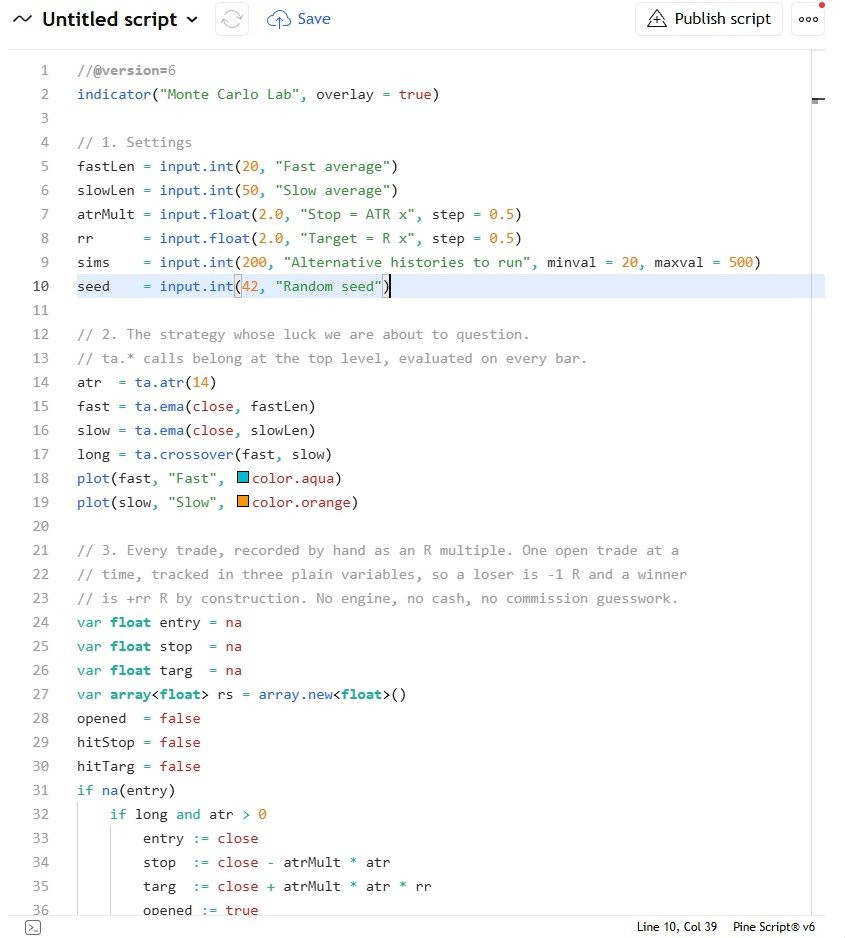
In TradingView: open the Pine Editor, create a new indicator, paste the code, then click "Add to chart".
//@version=6
indicator("Monte Carlo Lab", overlay = true)

// 1. Settings
fastLen = input.int(20, "Fast average")
slowLen = input.int(50, "Slow average")
atrMult = input.float(2.0, "Stop = ATR x", step = 0.5)
rr      = input.float(2.0, "Target = R x", step = 0.5)
sims    = input.int(200, "Alternative histories to run", minval = 20, maxval = 500)
seed    = input.int(42, "Random seed")

// 2. The strategy whose luck we are about to question.
// ta.* calls belong at the top level, evaluated on every bar.
atr  = ta.atr(14)
fast = ta.ema(close, fastLen)
slow = ta.ema(close, slowLen)
long = ta.crossover(fast, slow)
plot(fast, "Fast", color.aqua)
plot(slow, "Slow", color.orange)

// 3. Every trade, recorded by hand as an R multiple. One open trade at a
// time, tracked in three plain variables, so a loser is -1 R and a winner
// is +rr R by construction. No engine, no cash, no commission guesswork.
var float entry = na
var float stop  = na
var float targ  = na
var array<float> rs = array.new<float>()
opened  = false
hitStop = false
hitTarg = false
if na(entry)
    if long and atr > 0
        entry := close
        stop  := close - atrMult * atr
        targ  := close + atrMult * atr * rr
        opened := true
else
    if low <= stop
        array.push(rs, -1.0)
        entry := na
        hitStop := true
    else if high >= targ
        array.push(rs, rr)
        entry := na
        hitTarg := true
plotshape(opened, "Entry", shape.triangleup, location.belowbar, color.teal)
plotshape(hitTarg, "Target", shape.triangledown, location.abovebar, color.green)
plotshape(hitStop, "Stop", shape.xcross, location.abovebar, color.red)

// 4. A reproducible random number generator (Pine has none).
// The state lives in a one-slot array: a function may not assign to a global.
var array<int> rngBox = array.new_int(1, seed)
nextRand() =>
    st = (1103515245 * array.get(rngBox, 0) + 12345) % 2147483648
    array.set(rngBox, 0, st)
    math.abs(st) / 2147483648.0

// 5. One alternative history: the same trades, dealt in a different order.
// Fisher-Yates is the only correct way to shuffle a list, and it is four lines.
// We return the two things we care about: where it finished, and how bad it got.
shuffledRun(src) =>
    n = array.size(src)
    work = array.copy(src)
    for i = n - 1 to 1
        j = math.floor(nextRand() * (i + 1))
        tmp = array.get(work, i)
        array.set(work, i, array.get(work, j))
        array.set(work, j, tmp)
    run = 0.0
    peak = 0.0
    dd = 0.0
    for i = 0 to n - 1
        run += array.get(work, i)
        peak := math.max(peak, run)
        dd := math.max(dd, peak - run)
    [run, dd]

// 6. Two tables: the numbers, and a histogram of how painful the ride was
var table t = table.new(position.bottom_left, 2, 7, border_width = 1)
row(r, a, b, bg) =>
    table.cell(t, 0, r, a, text_color = color.white, text_size = size.normal,
      bgcolor = color.new(color.gray, 20), text_halign = text.align_left)
    table.cell(t, 1, r, b, text_color = color.white, bgcolor = bg,
      text_size = size.normal)
var table h = table.new(position.middle_right, 3, 16, border_width = 1)
blocks(count, pk) =>
    w = int(math.round(24.0 * count / math.max(pk, 1)))
    s = ""
    // a Pine for-loop with a start above its end counts DOWNWARDS,
    // so an empty bin would print two blocks instead of none
    if w > 0
        for i = 1 to w
            s += "█"
    s

// 7. Run the simulation on the last bar
if barstate.islast and array.size(rs) > 20
    n = array.size(rs)
    // the real, historical order: this is the curve every backtest shows you
    realRun = 0.0
    realPeak = 0.0
    realDd = 0.0
    for i = 0 to n - 1
        realRun += array.get(rs, i)
        realPeak := math.max(realPeak, realRun)
        realDd := math.max(realDd, realPeak - realRun)
    finals = array.new<float>()
    worst  = array.new<float>()
    for s = 0 to sims - 1
        [f, d] = shuffledRun(rs)
        array.push(finals, f)
        array.push(worst, d)

    // 8. Bin the drawdowns. This is the distribution that actually matters,
    // because the drawdown is the part of a backtest you have to live through.
    ddMax = math.max(array.max(worst), realDd)
    binW  = ddMax / 12
    counts = array.new_int(12, 0)
    for i = 0 to sims - 1
        b = math.min(11, math.floor(array.get(worst, i) / binW))
        array.set(counts, b, array.get(counts, b) + 1)
    pk = array.max(counts)
    table.cell(h, 0, 0, "max DD", text_color = color.white,
      bgcolor = color.new(color.blue, 20), text_size = size.small)
    table.cell(h, 1, 0, "HOW OFTEN", text_color = color.white,
      bgcolor = color.new(color.blue, 20), text_size = size.small)
    table.cell(h, 2, 0, "", bgcolor = color.new(color.blue, 20))
    for b = 0 to 11
        lo = b * binW
        mine = realDd >= lo and realDd < lo + binW
        table.cell(h, 0, 12 - b, str.tostring(lo, "#0.0") + "R",
          text_color = color.white, bgcolor = color.new(color.gray, 30),
          text_size = size.tiny)
        table.cell(h, 1, 12 - b, blocks(array.get(counts, b), pk),
          text_color = lo > realDd ? color.red : color.teal,
          bgcolor = color.new(color.black, 0), text_size = size.tiny,
          text_halign = text.align_left)
        table.cell(h, 2, 12 - b, mine ? "<- your backtest" : "",
          text_color = color.yellow, bgcolor = color.new(color.black, 0),
          text_size = size.tiny, text_halign = text.align_left)

    // 9. The numbers underneath
    sortedD = array.copy(worst)
    array.sort(sortedD)
    d50 = array.get(sortedD, math.floor(sims * 0.50))
    d95 = array.get(sortedD, math.floor(sims * 0.95))
    spread = array.max(finals) - array.min(finals)
    row(0, "MONTE CARLO", str.tostring(sims) + " orders of " +
      str.tostring(n) + " trades", color.new(color.blue, 20))
    row(1, "your backtest ended", str.tostring(realRun, "#.0") + "R",
      color.new(color.orange, 25))
    row(2, "best minus worst ending", str.tostring(spread, "#.00") + "R",
      color.new(color.gray, 25))
    row(3, "your backtest's drawdown", str.tostring(realDd, "#.0") + "R",
      color.new(color.orange, 25))
    row(4, "median drawdown", str.tostring(d50, "#.0") + "R",
      color.new(color.gray, 25))
    row(5, "95th percentile drawdown", str.tostring(d95, "#.0") + "R",
      color.new(color.red, 25))
    row(6, "times worse than you saw",
      str.tostring(d95 / math.max(realDd, 0.01), "#.00") + "x",
      color.new(color.red, 25))
Watch it built
This script is written and explained step by step in the video lesson.
Need a custom indicator or strategy?
Non-repainting Pine Script v6, backtested with real costs, alert and webhook ready. Fixed quote within 24 hours.