Snapshots
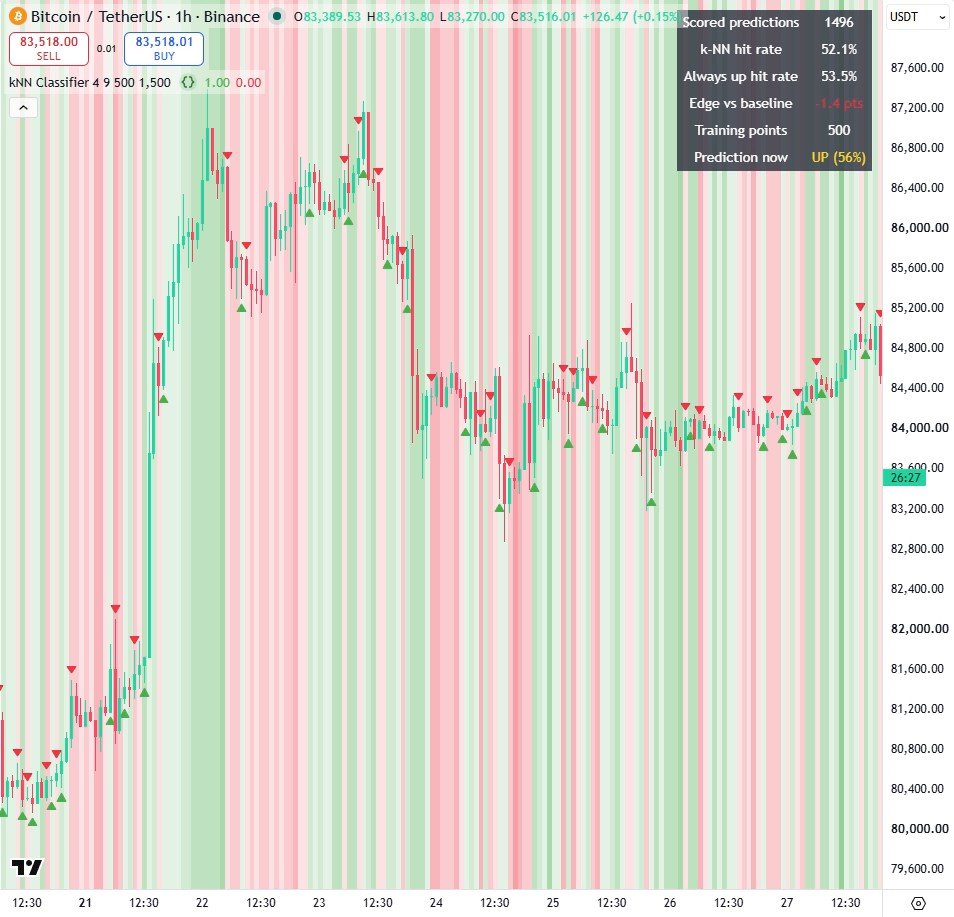
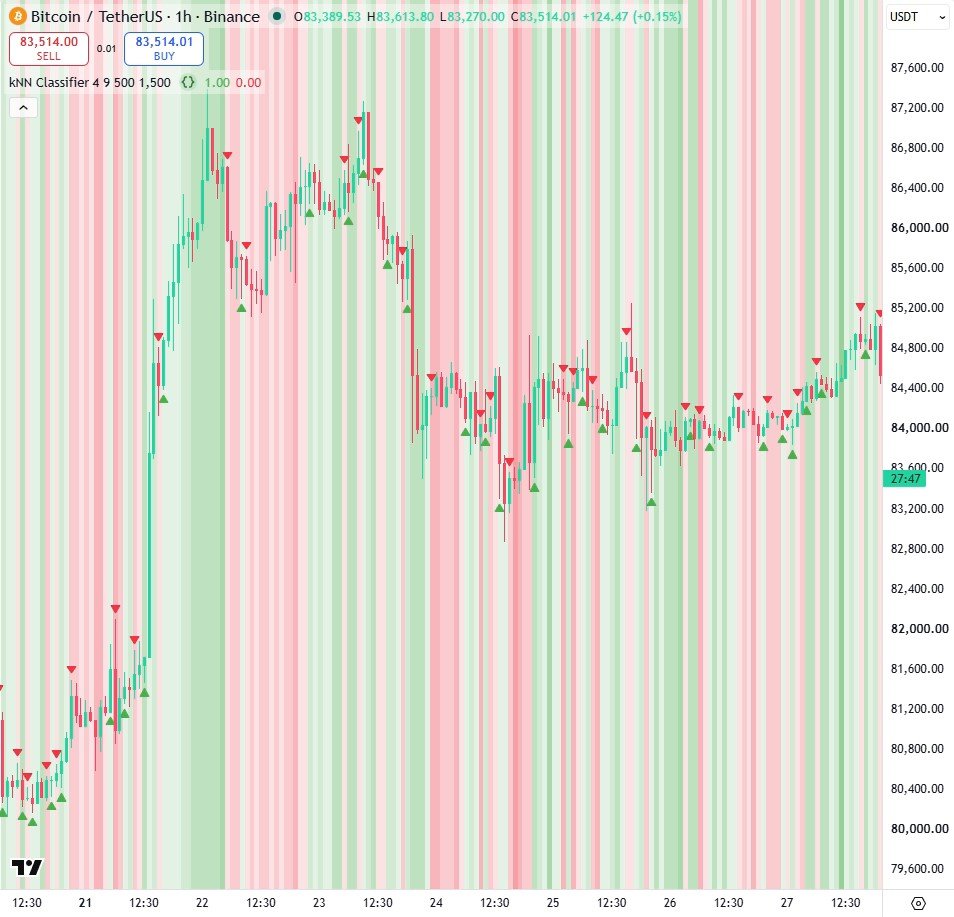
How it works
- Features: a rescaled RSI, the fast minus slow moving average gap in ATRs, and the candle range against the ATR, each clamped to between -1 and 1.
- Each sample waits in a pending queue until its outcome is known, then joins a training set capped at 500, so no label ever uses future data.
- The 9 nearest neighbours (Lorentzian or Euclidean distance) vote on the direction, and each prediction is scored only once its own outcome is known.
Settings
| Setting | Default | What it does |
|---|---|---|
| Bars ahead to predict | 4 | Forecast horizon |
| Neighbours (k) | 9 | How many nearest samples vote |
| Training memory | 500 | Maximum labelled samples kept |
| Predict window | 1500 | Only predict on the most recent bars, for execution time |
| Lorentzian distance | true | Lorentzian instead of Euclidean distance |
Source code
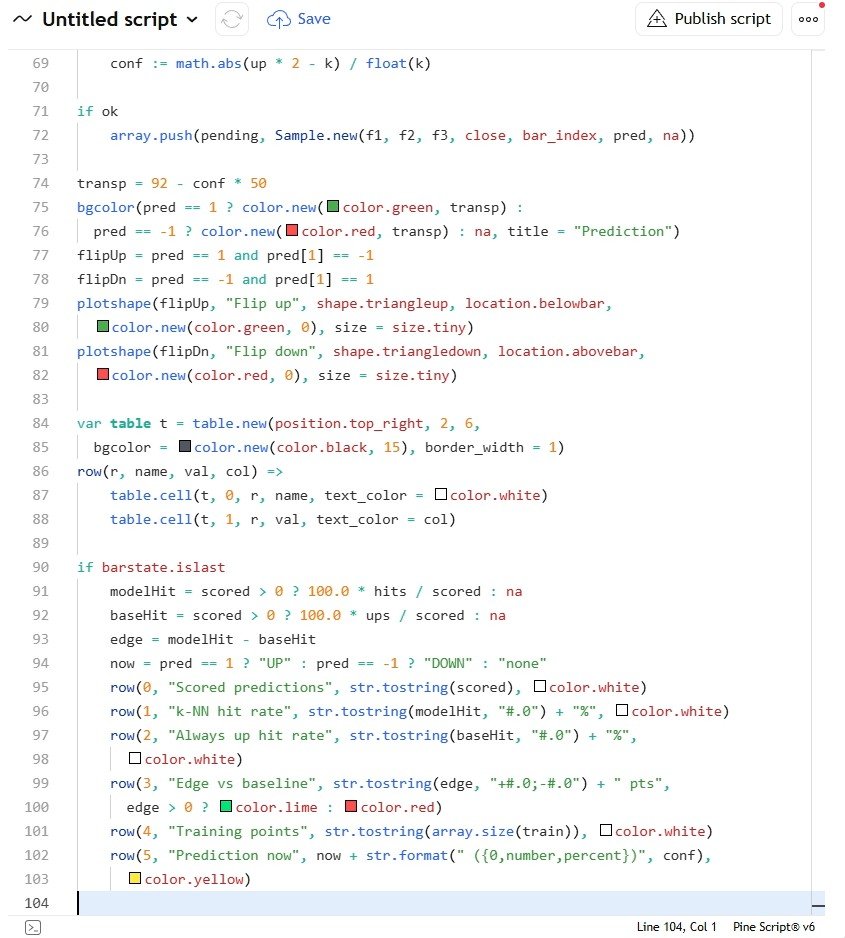
In TradingView: open the Pine Editor, create a new indicator, paste the code, then click "Add to chart".
//@version=6
indicator("kNN Classifier", overlay = true, max_bars_back = 500)

horizon = input.int(4, "Bars ahead to predict", minval = 1, maxval = 50)
k = input.int(9, "Neighbours (k)", minval = 1, maxval = 50)
maxTrain = input.int(500, "Training memory", minval = 50, maxval = 1000)
window = input.int(1500, "Predict window", minval = 100, maxval = 3000)
useLorentz = input.bool(true, "Lorentzian distance")

clamp(x) => math.max(-1.0, math.min(1.0, x))
atr = ta.atr(14)
f1 = (ta.rsi(close, 14) - 50) / 50
f2 = clamp((ta.ema(close, 8) - ta.ema(close, 34)) / (2 * atr))
f3 = clamp((high - low) / atr - 1)

type Sample
    float a
    float b
    float c
    float entry
    int bar
    int pred
    int label

var array<Sample> pending = array.new<Sample>()
var array<Sample> train = array.new<Sample>()
var int scored = 0
var int hits = 0
var int ups = 0

while array.size(pending) > 0
    if array.first(pending).bar > bar_index - horizon
        break
    Sample s = array.shift(pending)
    s.label := close > s.entry ? 1 : 0
    array.push(train, s)
    if s.pred != 0
        scored += 1
        hits += (s.pred == 1) == (s.label == 1) ? 1 : 0
        ups += s.label
while array.size(train) > maxTrain
    array.shift(train)

dist(Sample s, float a, float b, float c) =>
    da = math.abs(s.a - a)
    db = math.abs(s.b - b)
    dc = math.abs(s.c - c)
    useLorentz ? math.log(1 + da) + math.log(1 + db) + math.log(1 + dc) :
      math.sqrt(da * da + db * db + dc * dc)

int pred = 0
float conf = 0.0
ok = not na(f1) and not na(f2) and not na(f3)
live = bar_index > last_bar_index - window
if ok and live and array.size(train) >= k
    kd = array.new<float>()
    kl = array.new<int>()
    for s in train
        d = dist(s, f1, f2, f3)
        if array.size(kd) < k
            array.push(kd, d)
            array.push(kl, s.label)
        else if d < array.max(kd)
            w = array.indexof(kd, array.max(kd))
            array.set(kd, w, d)
            array.set(kl, w, s.label)
    up = array.sum(kl)
    pred := up * 2 > k ? 1 : up * 2 < k ? -1 : 0
    conf := math.abs(up * 2 - k) / float(k)

if ok
    array.push(pending, Sample.new(f1, f2, f3, close, bar_index, pred, na))

transp = 92 - conf * 50
bgcolor(pred == 1 ? color.new(color.green, transp) :
  pred == -1 ? color.new(color.red, transp) : na, title = "Prediction")
flipUp = pred == 1 and pred[1] == -1
flipDn = pred == -1 and pred[1] == 1
plotshape(flipUp, "Flip up", shape.triangleup, location.belowbar,
  color.new(color.green, 0), size = size.tiny)
plotshape(flipDn, "Flip down", shape.triangledown, location.abovebar,
  color.new(color.red, 0), size = size.tiny)

var table t = table.new(position.top_right, 2, 6,
  bgcolor = color.new(color.black, 15), border_width = 1)
row(r, name, val, col) =>
    table.cell(t, 0, r, name, text_color = color.white)
    table.cell(t, 1, r, val, text_color = col)

if barstate.islast
    modelHit = scored > 0 ? 100.0 * hits / scored : na
    baseHit = scored > 0 ? 100.0 * ups / scored : na
    edge = modelHit - baseHit
    now = pred == 1 ? "UP" : pred == -1 ? "DOWN" : "none"
    row(0, "Scored predictions", str.tostring(scored), color.white)
    row(1, "k-NN hit rate", str.tostring(modelHit, "#.0") + "%", color.white)
    row(2, "Always up hit rate", str.tostring(baseHit, "#.0") + "%",
      color.white)
    row(3, "Edge vs baseline", str.tostring(edge, "+#.0;-#.0") + " pts",
      edge > 0 ? color.lime : color.red)
    row(4, "Training points", str.tostring(array.size(train)), color.white)
    row(5, "Prediction now", now + str.format(" ({0,number,percent})", conf),
      color.yellow)
Watch it built
This script is written and explained step by step in the video lesson.
Need a custom indicator or strategy?
Non-repainting Pine Script v6, backtested with real costs, alert and webhook ready. Fixed quote within 24 hours.