Snapshots
How it works
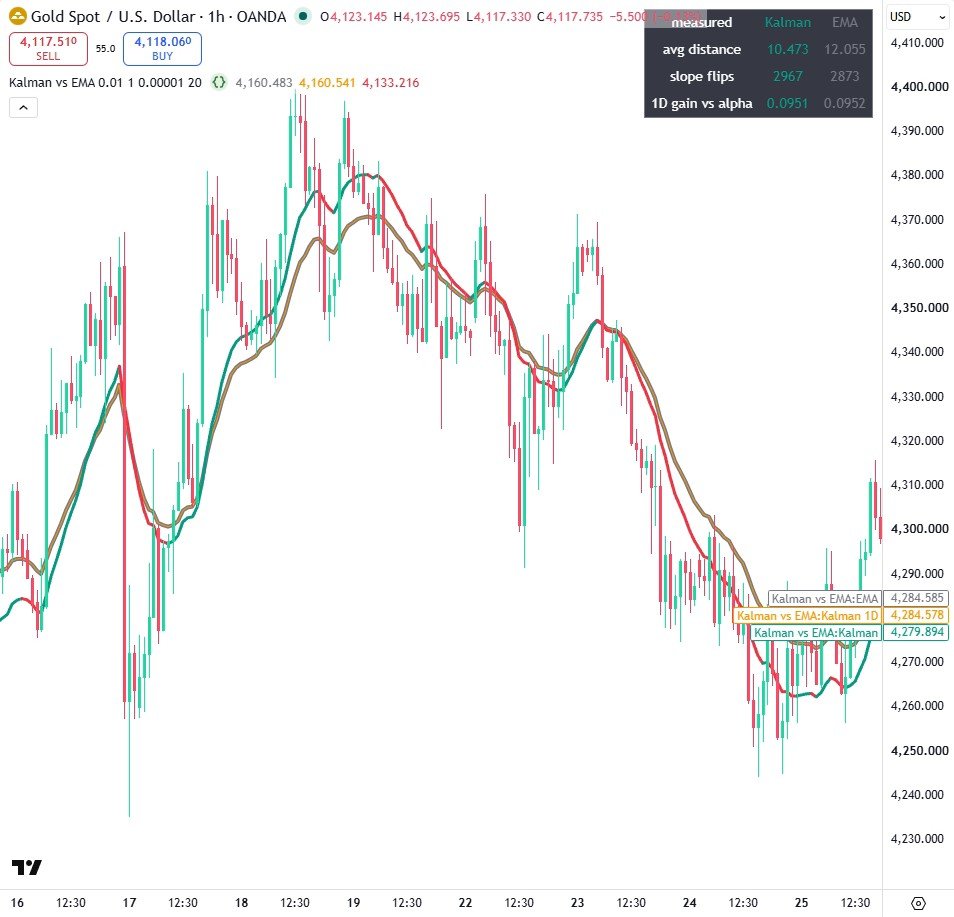
- Predict then update: the gain K = P / (P + R) decides how far the estimate moves toward each new close.
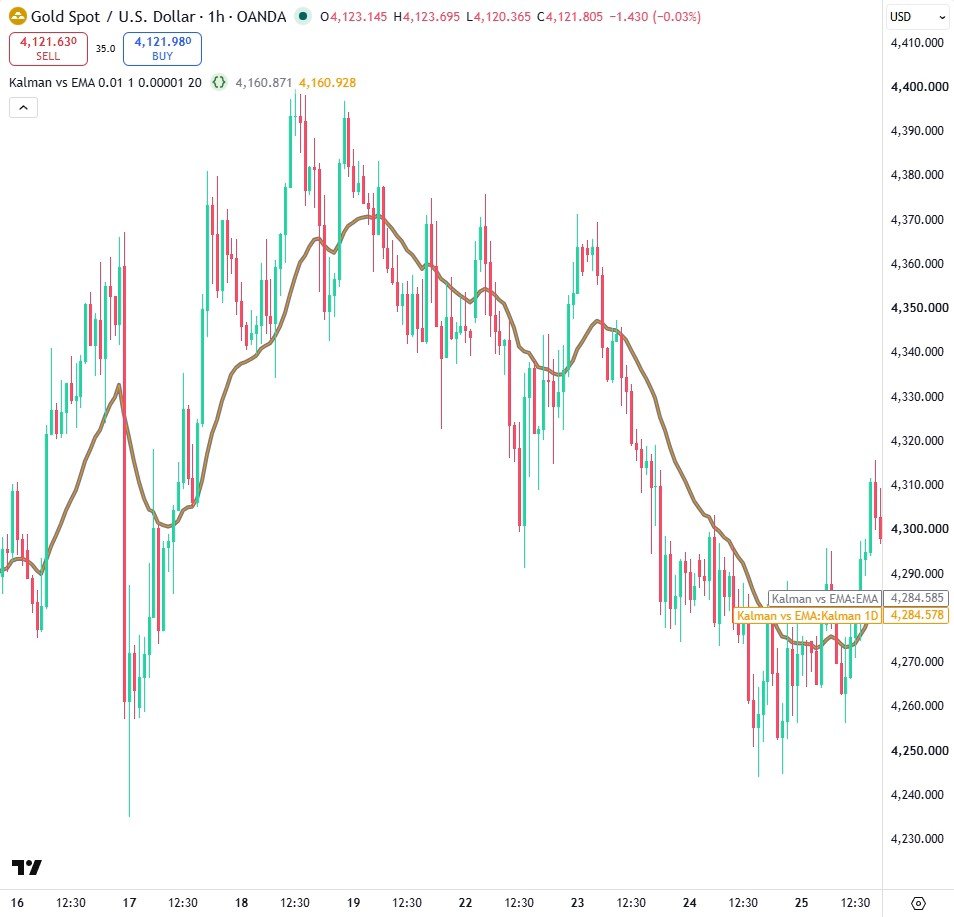
- With fixed Q and R the 1-D gain settles to a constant, which makes it an EMA; the table shows the settled gain next to the EMA's alpha.
- The price plus velocity version tracks the slope as well, and the table measures its lag and whipsaws against the EMA after the first 200 bars.
Settings
| Setting | Default | What it does |
|---|---|---|
| Q, process noise | 0.01 | How much the filter trusts its model to change |
| R, measurement noise | 1.0 | How much it distrusts each new price |
| Velocity noise | 0.00001 | Process noise of the velocity state |
| EMA to compare against | 20 | Length of the comparison EMA |
Source code
In TradingView: open the Pine Editor, create a new indicator, paste the code, then click "Add to chart".
//@version=6
indicator("Kalman vs EMA", overlay = true)

qIn = input.float(0.01, "Q, process noise", minval = 0.00001, step = 0.001)
rIn = input.float(1.0, "R, measurement noise", minval = 0.00001, step = 0.1)
qvIn = input.float(0.00001, "Velocity noise", minval = 0.0, step = 0.00001)
emaLen = input.int(20, "EMA to compare against", minval = 2)

var float x1 = na
var float p1 = 1.0

if na(x1)
    x1 := close
p1 := p1 + qIn
float k1 = p1 / (p1 + rIn)
x1 := x1 + k1 * (close - x1)
p1 := (1 - k1) * p1

ema = ta.ema(close, emaLen)
plot(ema, "EMA", color.new(color.gray, 0), 4)
plot(x1, "Kalman 1D", color.new(color.orange, 0), 1)

var float x = na
var float v = 0.0
var float p00 = 1.0
var float p01 = 0.0
var float p11 = 1.0

if na(x)
    x := close
x := x + v
p00 := p00 + 2 * p01 + p11 + qIn
p01 := p01 + p11
p11 := p11 + qvIn

float s = p00 + rIn
float k0 = p00 / s
float kv = p01 / s
float y = close - x
x := x + k0 * y
v := v + kv * y
p11 := p11 - kv * p01
p01 := (1 - k0) * p01
p00 := (1 - k0) * p00

rising = x > x[1]
plot(x, "Kalman", rising ? color.teal : color.red, 3)

var float distK = 0.0
var float distE = 0.0
var int nBars = 0
var int flipK = 0
var int flipE = 0
if bar_index >= 200
    nBars += 1
    distK += math.abs(close - x)
    distE += math.abs(close - ema)
    if (x - x[1]) * (x[1] - x[2]) < 0
        flipK += 1
    if (ema - ema[1]) * (ema[1] - ema[2]) < 0
        flipE += 1

var table t = table.new(position.top_right, 3, 4, bgcolor = color.black,
  frame_width = 1, frame_color = color.gray, border_width = 1)
row(r, name, a, b) =>
    table.cell(t, 0, r, name, text_color = color.white)
    table.cell(t, 1, r, a, text_color = color.teal)
    table.cell(t, 2, r, b, text_color = color.gray)

if barstate.islast and nBars > 0
    row(0, "measured", "Kalman", "EMA")
    row(1, "avg distance", str.tostring(distK / nBars, format.mintick),
      str.tostring(distE / nBars, format.mintick))
    row(2, "slope flips", str.tostring(flipK), str.tostring(flipE))
    row(3, "1D gain vs alpha", str.tostring(k1, "#.####"),
      str.tostring(2.0 / (emaLen + 1), "#.####"))
Watch it built
This script is written and explained step by step in the video lesson.
Need a custom indicator or strategy?
Non-repainting Pine Script v6, backtested with real costs, alert and webhook ready. Fixed quote within 24 hours.