Snapshots
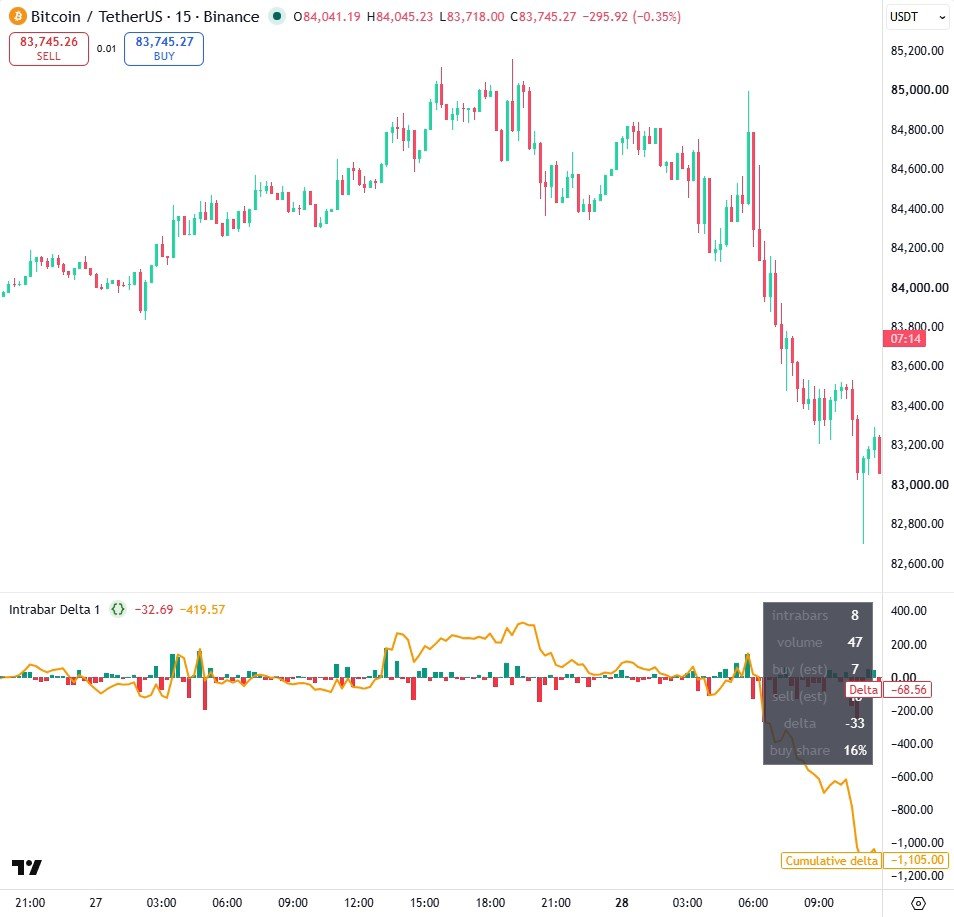
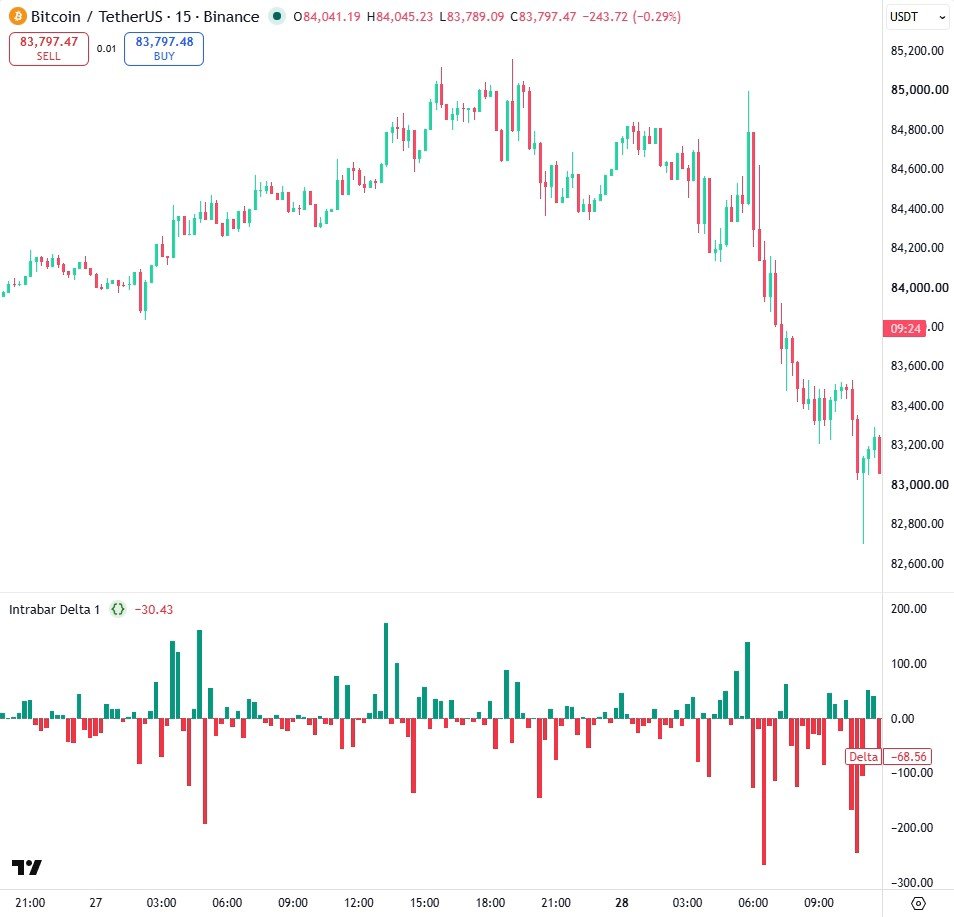
How it works
- One tuple call to request.security_lower_tf returns arrays of 1 minute opens, closes and volumes for each chart candle.
- A guarded loop counts up-closing minutes as buying and down-closing minutes as selling, and splits flat minutes half and half; with no intrabars delta is na, not zero.
- It is an estimate from one exchange's volume, not real order flow, and older candles return empty arrays once the intrabar history limit is reached.
Settings
| Setting | Default | What it does |
|---|---|---|
| Intrabar timeframe | 1 | The lower timeframe read inside each candle |
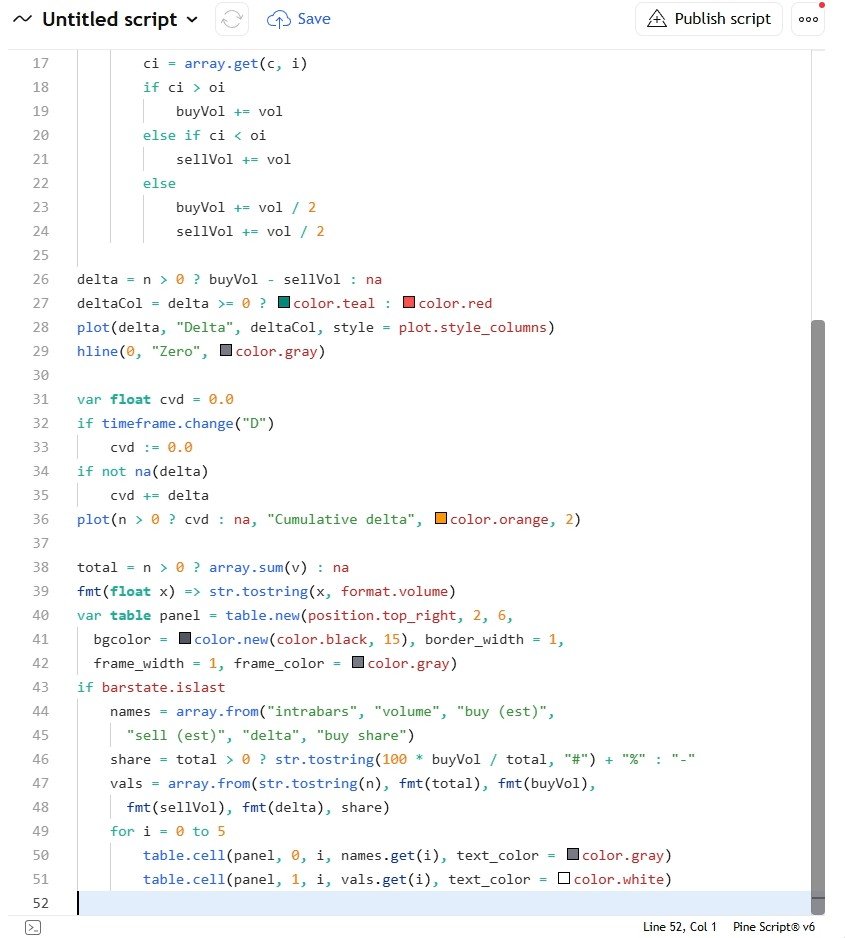
Source code
In TradingView: open the Pine Editor, create a new indicator, paste the code, then click "Add to chart".
//@version=6
indicator("Intrabar Delta", overlay = false)

ltf = input.timeframe("1", "Intrabar timeframe")

[o, c, v] = request.security_lower_tf(syminfo.tickerid, ltf,
  [open, close, volume])

n = array.size(c)
float buyVol = 0.0
float sellVol = 0.0

if n > 0
    for i = 0 to n - 1
        vol = nz(array.get(v, i))
        oi = array.get(o, i)
        ci = array.get(c, i)
        if ci > oi
            buyVol += vol
        else if ci < oi
            sellVol += vol
        else
            buyVol += vol / 2
            sellVol += vol / 2

delta = n > 0 ? buyVol - sellVol : na
deltaCol = delta >= 0 ? color.teal : color.red
plot(delta, "Delta", deltaCol, style = plot.style_columns)
hline(0, "Zero", color.gray)

var float cvd = 0.0
if timeframe.change("D")
    cvd := 0.0
if not na(delta)
    cvd += delta
plot(n > 0 ? cvd : na, "Cumulative delta", color.orange, 2)

total = n > 0 ? array.sum(v) : na
fmt(float x) => str.tostring(x, format.volume)
var table panel = table.new(position.top_right, 2, 6,
  bgcolor = color.new(color.black, 15), border_width = 1,
  frame_width = 1, frame_color = color.gray)
if barstate.islast
    names = array.from("intrabars", "volume", "buy (est)",
      "sell (est)", "delta", "buy share")
    share = total > 0 ? str.tostring(100 * buyVol / total, "#") + "%" : "-"
    vals = array.from(str.tostring(n), fmt(total), fmt(buyVol),
      fmt(sellVol), fmt(delta), share)
    for i = 0 to 5
        table.cell(panel, 0, i, names.get(i), text_color = color.gray)
        table.cell(panel, 1, i, vals.get(i), text_color = color.white)
Watch it built
This script is written and explained step by step in the video lesson.
Need a custom indicator or strategy?
Non-repainting Pine Script v6, backtested with real costs, alert and webhook ready. Fixed quote within 24 hours.