Snapshots
How it works
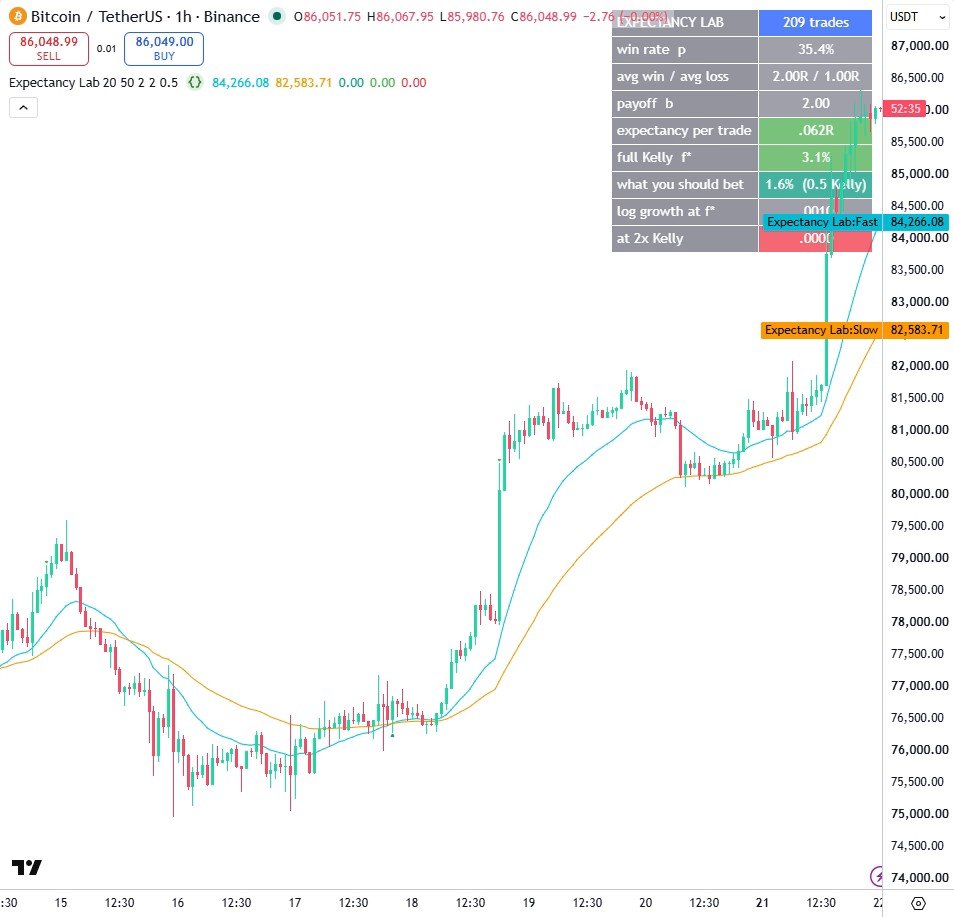
- Trades are tracked in ordinary variables: one open trade at a time, a loser is -1R and a winner is the reward multiple, by construction.
- Expectancy is the mean of that R list; the Kelly fraction follows from the win rate and the payoff ratio, both measured, never assumed.
- The table also shows the growth rate at twice Kelly, which is where a winning edge still ends in ruin.
Settings
| Setting | Default | What it does |
|---|---|---|
| Fast average | 20 | Fast moving-average length |
| Slow average | 50 | Slow moving-average length |
| Stop = ATR x | 2.0 | Stop distance, in ATRs |
| Target = R x | 2.0 | Target distance, as a multiple of the risk |
| Kelly fraction to actually use | 0.5 | Fraction of full Kelly to bet, because full Kelly is violent |
Source code
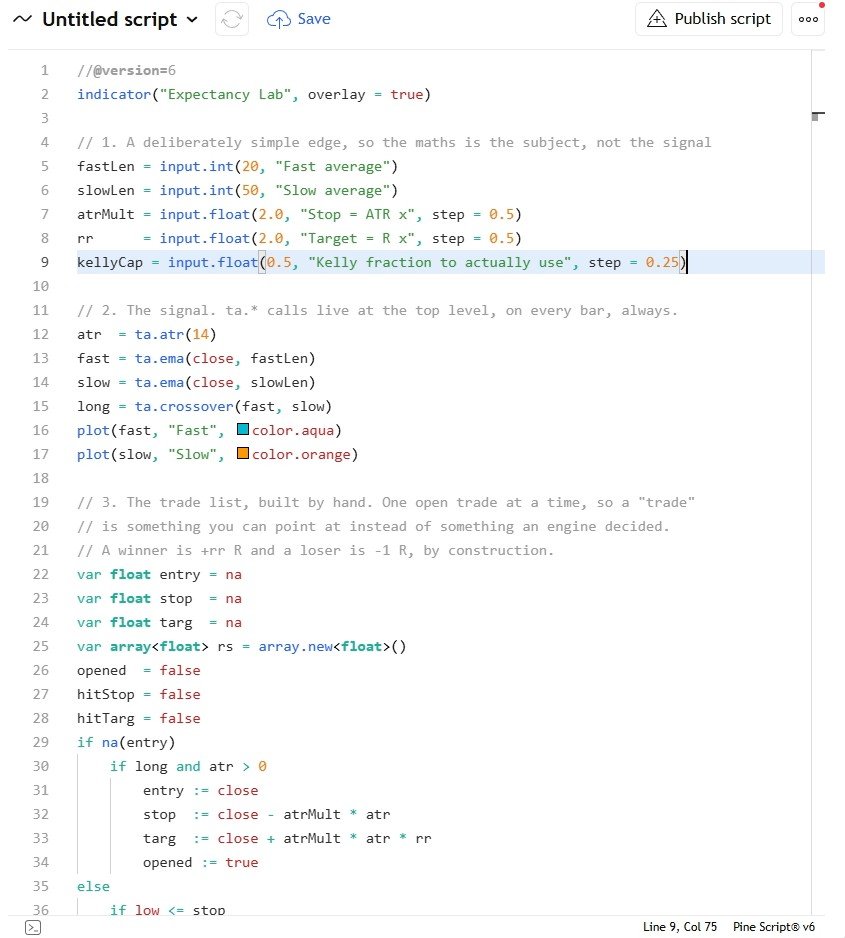
In TradingView: open the Pine Editor, create a new indicator, paste the code, then click "Add to chart".
//@version=6
indicator("Expectancy Lab", overlay = true)

// 1. A deliberately simple edge, so the maths is the subject, not the signal
fastLen = input.int(20, "Fast average")
slowLen = input.int(50, "Slow average")
atrMult = input.float(2.0, "Stop = ATR x", step = 0.5)
rr      = input.float(2.0, "Target = R x", step = 0.5)
kellyCap = input.float(0.5, "Kelly fraction to actually use", step = 0.25)

// 2. The signal. ta.* calls live at the top level, on every bar, always.
atr  = ta.atr(14)
fast = ta.ema(close, fastLen)
slow = ta.ema(close, slowLen)
long = ta.crossover(fast, slow)
plot(fast, "Fast", color.aqua)
plot(slow, "Slow", color.orange)

// 3. The trade list, built by hand. One open trade at a time, so a "trade"
// is something you can point at instead of something an engine decided.
// A winner is +rr R and a loser is -1 R, by construction.
var float entry = na
var float stop  = na
var float targ  = na
var array<float> rs = array.new<float>()
opened  = false
hitStop = false
hitTarg = false
if na(entry)
    if long and atr > 0
        entry := close
        stop  := close - atrMult * atr
        targ  := close + atrMult * atr * rr
        opened := true
else
    if low <= stop
        array.push(rs, -1.0)
        entry := na
        hitStop := true
    else if high >= targ
        array.push(rs, rr)
        entry := na
        hitTarg := true
plotshape(opened, "Entry", shape.triangleup, location.belowbar, color.teal)
plotshape(hitTarg, "Target", shape.triangledown, location.abovebar, color.green)
plotshape(hitStop, "Stop", shape.xcross, location.abovebar, color.red)

// 4. The two numbers that decide everything
winRate() =>
    n = array.size(rs)
    w = 0
    for i = 0 to math.max(n - 1, 0)
        if n > 0 and array.get(rs, i) > 0
            w += 1
    n > 0 ? w / n : 0.0

avgOf(cond) =>
    n = array.size(rs)
    s = 0.0
    c = 0
    for i = 0 to math.max(n - 1, 0)
        if n > 0
            v = array.get(rs, i)
            if (cond and v > 0) or (not cond and v <= 0)
                s += v
                c += 1
    c > 0 ? s / c : 0.0

// 5. Long-run growth per trade if you bet a fraction f of the account
growth(f, p, q, b) =>
    f <= 0 or f >= 1 ? 0.0 : p * math.log(1 + f * b) + q * math.log(1 - f)

// 6. Expectancy, Kelly, and what over-betting does
var table t = table.new(position.top_right, 2, 9, border_width = 1)
row(r, a, b, bg) =>
    table.cell(t, 0, r, a, text_color = color.white, text_size = size.normal,
      bgcolor = color.new(color.gray, 20), text_halign = text.align_left)
    table.cell(t, 1, r, b, text_color = color.white, bgcolor = bg,
      text_size = size.normal)

if barstate.islast and array.size(rs) > 5
    n  = array.size(rs)
    p  = winRate()
    q  = 1 - p
    aw = avgOf(true)          // average win, in R
    al = math.abs(avgOf(false))   // average loss, in R
    b  = al > 0 ? aw / al : 0.0   // payoff ratio
    exp = p * aw - q * al         // expectancy per trade, in R
    kelly = b > 0 ? (p * b - q) / b : 0.0   // the full Kelly fraction
    used  = kelly * kellyCap
    // growth per trade at different bet sizes, from the same p and b
    gKelly  = growth(math.min(math.max(kelly, 0), 0.99), p, q, b)
    gDouble = growth(math.min(math.max(kelly * 2, 0), 0.99), p, q, b)
    row(0, "EXPECTANCY LAB", str.tostring(n) + " trades",
      color.new(color.blue, 20))
    row(1, "win rate  p", str.tostring(p * 100, "#.0") + "%",
      color.new(color.gray, 30))
    row(2, "avg win / avg loss", str.tostring(aw, "#.00") + "R / " +
      str.tostring(al, "#.00") + "R", color.new(color.gray, 30))
    row(3, "payoff  b", str.tostring(b, "#.00"), color.new(color.gray, 30))
    row(4, "expectancy per trade", str.tostring(exp, "#.000") + "R",
      exp > 0 ? color.new(color.green, 25) : color.new(color.red, 25))
    row(5, "full Kelly  f*", str.tostring(kelly * 100, "#.0") + "%",
      kelly > 0 ? color.new(color.green, 25) : color.new(color.red, 25))
    row(6, "what you should bet", str.tostring(used * 100, "#.0") + "%  (" +
      str.tostring(kellyCap, "#.##") + " Kelly)", color.new(color.teal, 25))
    row(7, "log growth at f*", str.tostring(gKelly, "#.0000"),
      color.new(color.gray, 30))
    worse = gDouble < gKelly
    row(8, "at 2x Kelly", str.tostring(gDouble, "#.0000") +
      (gDouble <= 0 ? "  RUIN" : ""),
      worse ? color.new(color.red, 25) : color.new(color.gray, 30))
Watch it built
This script is written and explained step by step in the video lesson.
Need a custom indicator or strategy?
Non-repainting Pine Script v6, backtested with real costs, alert and webhook ready. Fixed quote within 24 hours.