Snapshots
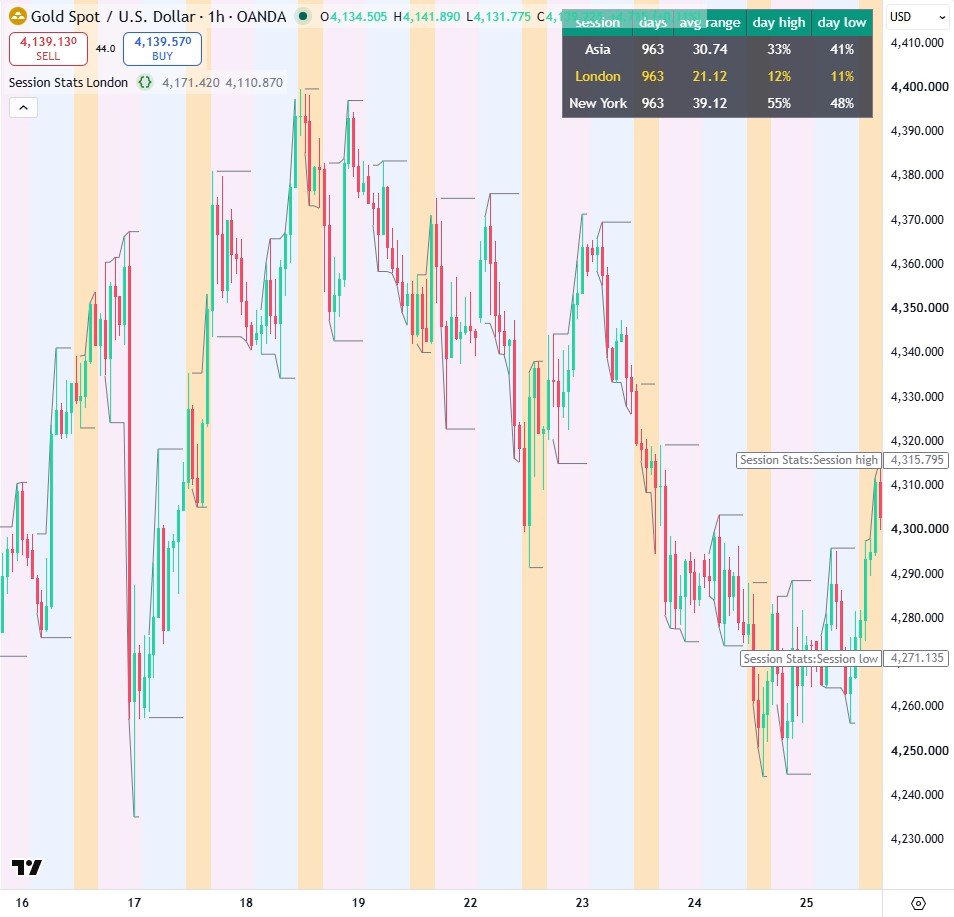
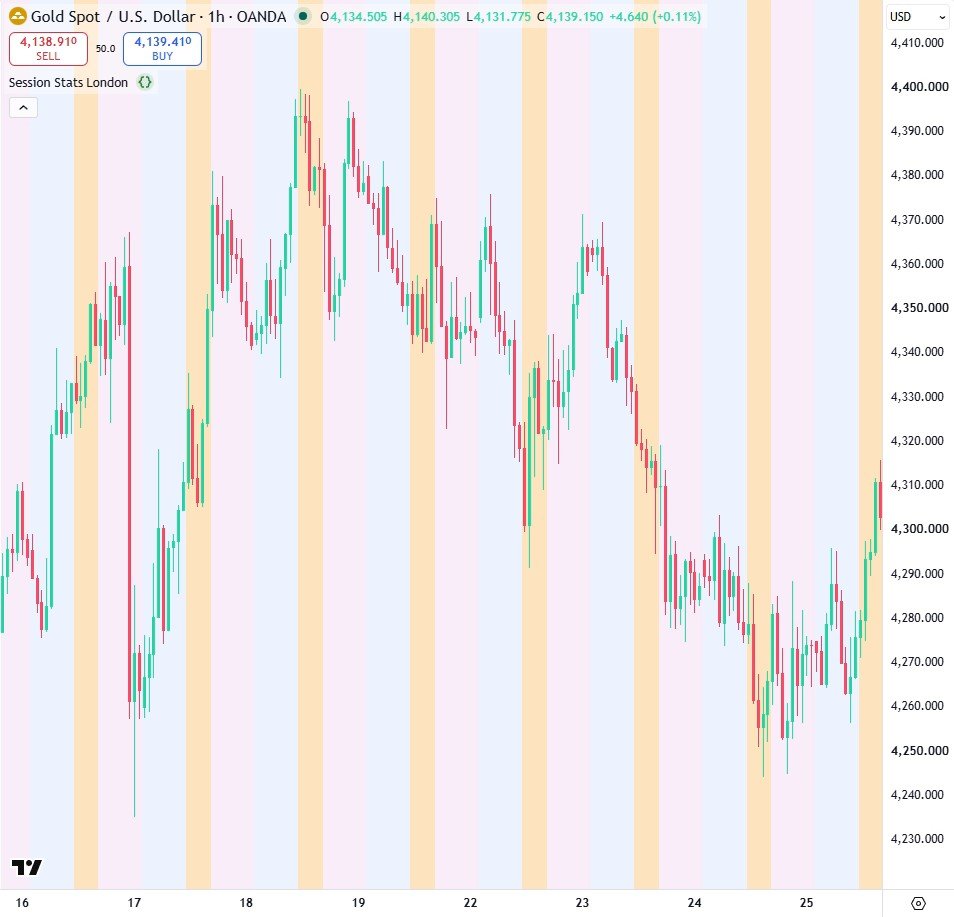
How it works
- enum Session lists Asia, London and New York, and input.enum turns it into a dropdown for the highlighted session.
- A SessionStats type carries days, range total and high/low counts, with methods update() and avgRange().
- A map from Session to SessionStats collects every finished trading day, so each percentage column adds up to about 100 as a built-in check.
Settings
| Setting | Default | What it does |
|---|---|---|
| Highlight session | London | Which session's row is highlighted in the table |
Source code
In TradingView: open the Pine Editor, create a new indicator, paste the code, then click "Add to chart".
//@version=6
indicator("Session Stats", overlay = true)

enum Session
    asia = "Asia"
    london = "London"
    newYork = "New York"

focus = input.enum(Session.london, "Highlight session")
tz = "America/New_York"

type SessionStats
    int days = 0
    float rangeSum = 0.0
    int highs = 0
    int lows = 0

method update(SessionStats this, float span, bool hi, bool lo) =>
    this.days += 1
    this.rangeSum += span
    this.highs += hi ? 1 : 0
    this.lows += lo ? 1 : 0
    this

method avgRange(SessionStats this) =>
    this.days > 0 ? this.rangeSum / this.days : na

h = hour(time, tz)
Session sess = h >= 17 or h < 3 ? Session.asia :
  h < 8 ? Session.london : Session.newYork
newSess = bar_index > 0 and sess != sess[1]
newDay = newSess and sess == Session.asia

col = switch sess
    Session.asia => color.blue
    Session.london => color.orange
    => color.purple
bgcolor(color.new(col, sess == focus ? 75 : 92), title = "Session")

var stats = map.new<Session, SessionStats>()
if barstate.isfirst
    stats.put(Session.asia, SessionStats.new())
    stats.put(Session.london, SessionStats.new())
    stats.put(Session.newYork, SessionStats.new())
var today = map.new<Session, float>()

var float sessHigh = na
var float sessLow = na
var float dayHigh = na
var float dayLow = na
var Session highSess = na
var Session lowSess = na
var int totalDays = 0

if newSess and not na(sessHigh)
    today.put(sess[1], sessHigh - sessLow)
if newDay
    if not na(dayHigh)
        for [k, r] in today
            stats.get(k).update(r, k == highSess, k == lowSess)
        totalDays += 1
    today.clear()
    dayHigh := high
    dayLow := low
    highSess := sess
    lowSess := sess

if newSess
    sessHigh := high
    sessLow := low
else
    sessHigh := math.max(sessHigh, high)
    sessLow := math.min(sessLow, low)
if high > dayHigh
    dayHigh := high
    highSess := sess
if low < dayLow
    dayLow := low
    lowSess := sess
plot(newSess ? na : sessHigh, "Session high", color.gray, 1,
  plot.style_linebr)
plot(newSess ? na : sessLow, "Session low", color.gray, 1,
  plot.style_linebr)

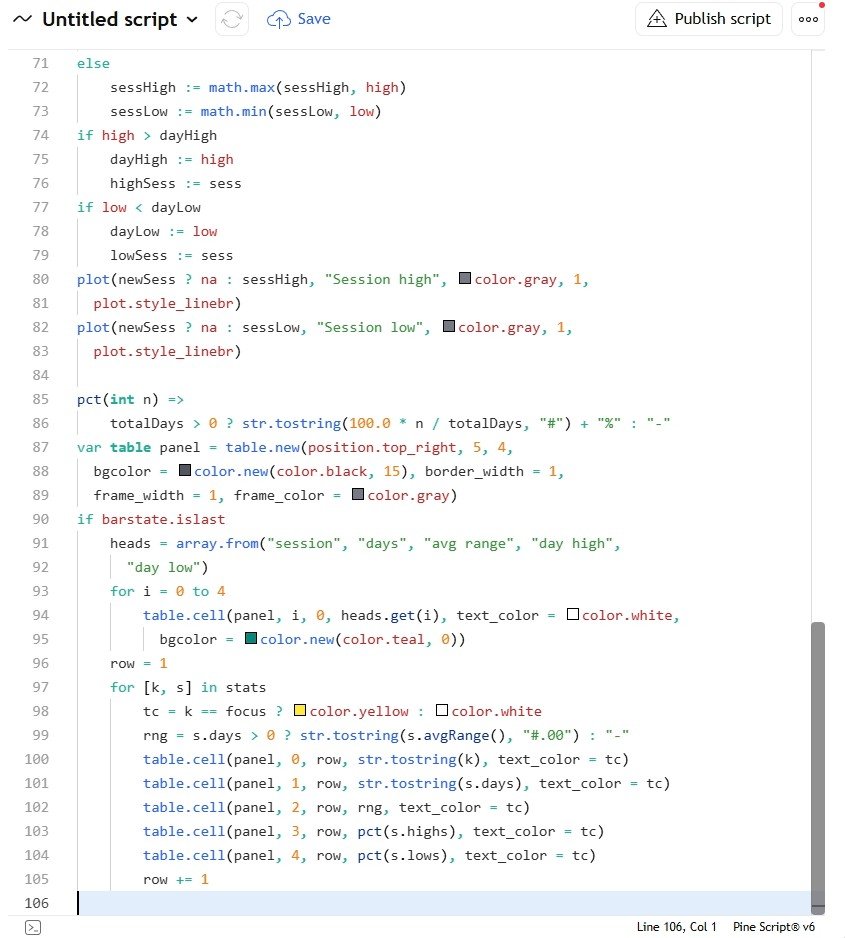
pct(int n) =>
    totalDays > 0 ? str.tostring(100.0 * n / totalDays, "#") + "%" : "-"
var table panel = table.new(position.top_right, 5, 4,
  bgcolor = color.new(color.black, 15), border_width = 1,
  frame_width = 1, frame_color = color.gray)
if barstate.islast
    heads = array.from("session", "days", "avg range", "day high",
      "day low")
    for i = 0 to 4
        table.cell(panel, i, 0, heads.get(i), text_color = color.white,
          bgcolor = color.new(color.teal, 0))
    row = 1
    for [k, s] in stats
        tc = k == focus ? color.yellow : color.white
        rng = s.days > 0 ? str.tostring(s.avgRange(), "#.00") : "-"
        table.cell(panel, 0, row, str.tostring(k), text_color = tc)
        table.cell(panel, 1, row, str.tostring(s.days), text_color = tc)
        table.cell(panel, 2, row, rng, text_color = tc)
        table.cell(panel, 3, row, pct(s.highs), text_color = tc)
        table.cell(panel, 4, row, pct(s.lows), text_color = tc)
        row += 1
Watch it built
This script is written and explained step by step in the video lesson.
Need a custom indicator or strategy?
Non-repainting Pine Script v6, backtested with real costs, alert and webhook ready. Fixed quote within 24 hours.