Snapshots
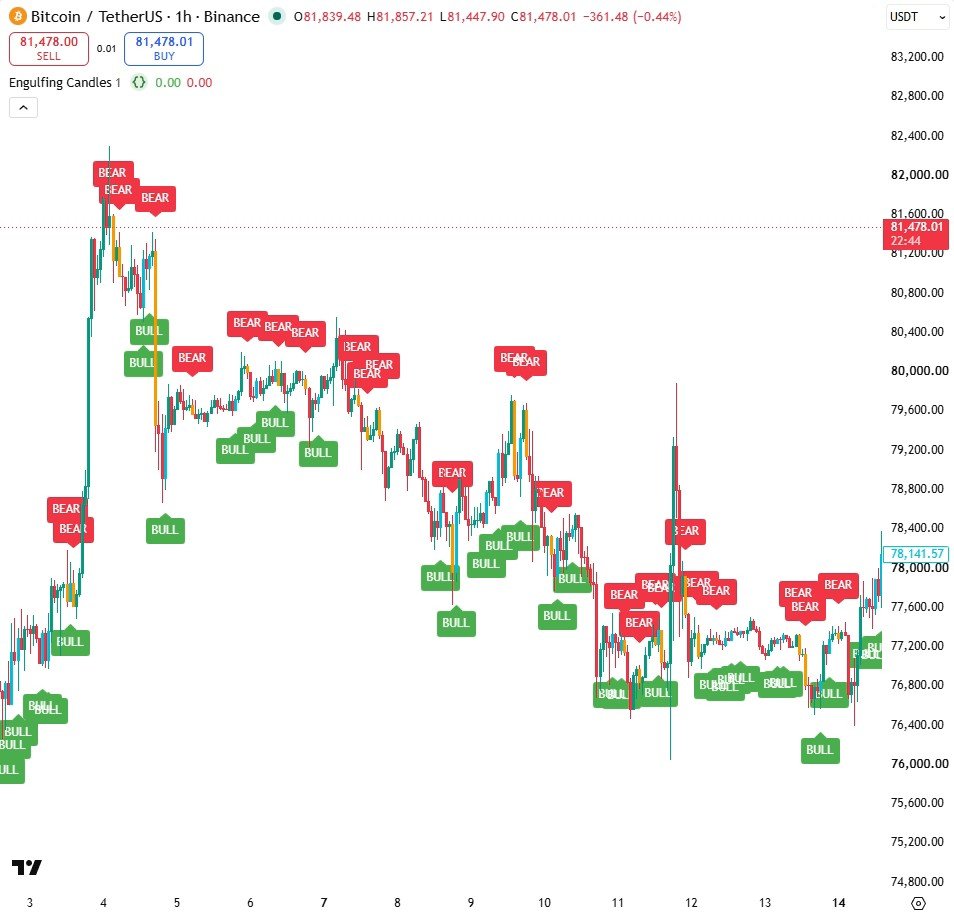
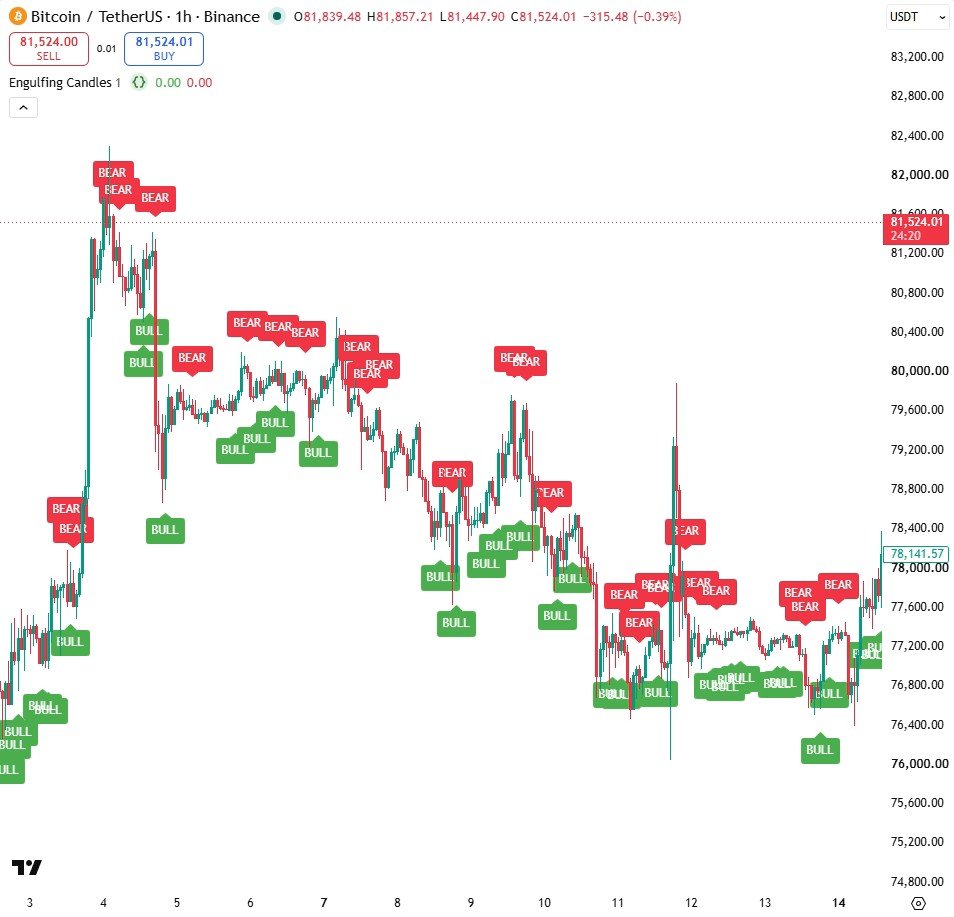
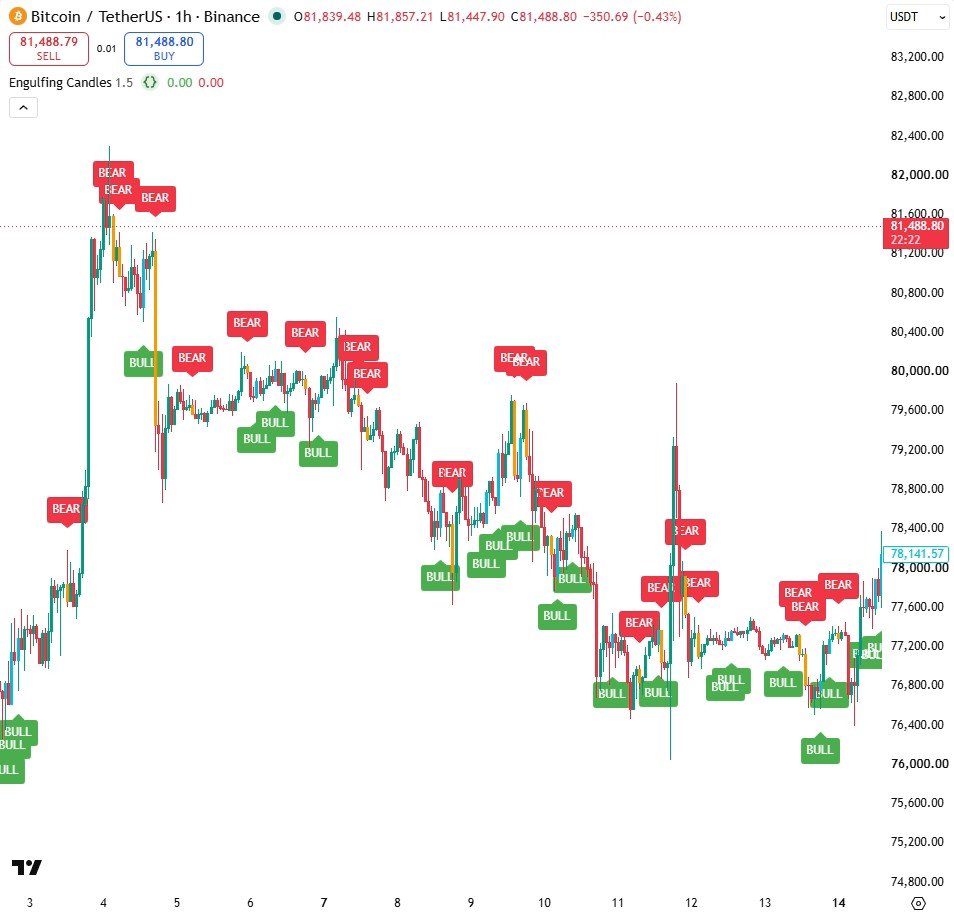
How it works
- A bullish engulfing needs a red candle followed by a green body that covers it, and is bigger by the ratio you set.
- math.abs measures each body, so the comparison ignores the direction of the candle.
- Create an alert on "Engulfing Candles" and pick "Bullish engulfing" or "Bearish engulfing".
Settings
| Setting | Default | What it does |
|---|---|---|
| Body size vs previous | 1.0 | How much bigger the new body must be than the previous one |
| Colour engulfing candles | true | Paint the engulfing candle aqua or orange |
Source code
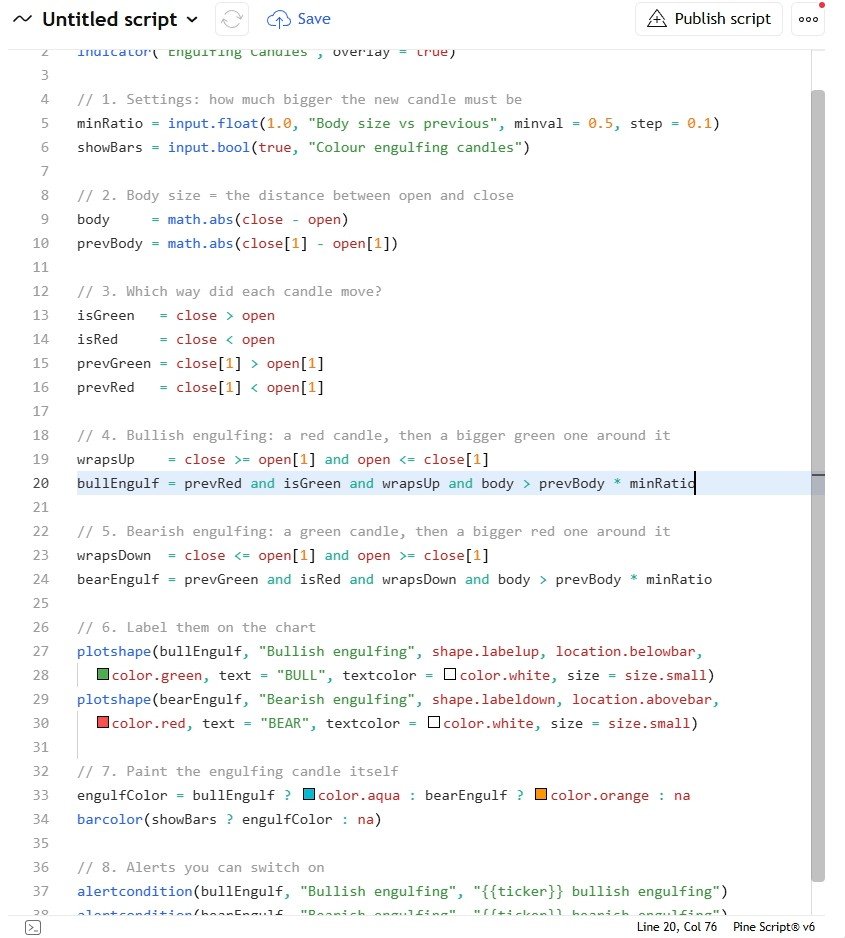
In TradingView: open the Pine Editor, create a new indicator, paste the code, then click "Add to chart".
//@version=6
indicator("Engulfing Candles", overlay = true)

// 1. Settings: how much bigger the new candle must be
minRatio = input.float(1.0, "Body size vs previous", minval = 0.5, step = 0.1)
showBars = input.bool(true, "Colour engulfing candles")

// 2. Body size = the distance between open and close
body     = math.abs(close - open)
prevBody = math.abs(close[1] - open[1])

// 3. Which way did each candle move?
isGreen   = close > open
isRed     = close < open
prevGreen = close[1] > open[1]
prevRed   = close[1] < open[1]

// 4. Bullish engulfing: a red candle, then a bigger green one around it
wrapsUp    = close >= open[1] and open <= close[1]
bullEngulf = prevRed and isGreen and wrapsUp and body > prevBody * minRatio

// 5. Bearish engulfing: a green candle, then a bigger red one around it
wrapsDown  = close <= open[1] and open >= close[1]
bearEngulf = prevGreen and isRed and wrapsDown and body > prevBody * minRatio

// 6. Label them on the chart
plotshape(bullEngulf, "Bullish engulfing", shape.labelup, location.belowbar,
  color.green, text = "BULL", textcolor = color.white, size = size.small)
plotshape(bearEngulf, "Bearish engulfing", shape.labeldown, location.abovebar,
  color.red, text = "BEAR", textcolor = color.white, size = size.small)

// 7. Paint the engulfing candle itself
engulfColor = bullEngulf ? color.aqua : bearEngulf ? color.orange : na
barcolor(showBars ? engulfColor : na)

// 8. Alerts you can switch on
alertcondition(bullEngulf, "Bullish engulfing", "{{ticker}} bullish engulfing")
alertcondition(bearEngulf, "Bearish engulfing", "{{ticker}} bearish engulfing")
Watch it built
This script is written and explained step by step in the video lesson.
Need a custom indicator or strategy?
Non-repainting Pine Script v6, backtested with real costs, alert and webhook ready. Fixed quote within 24 hours.