Snapshots
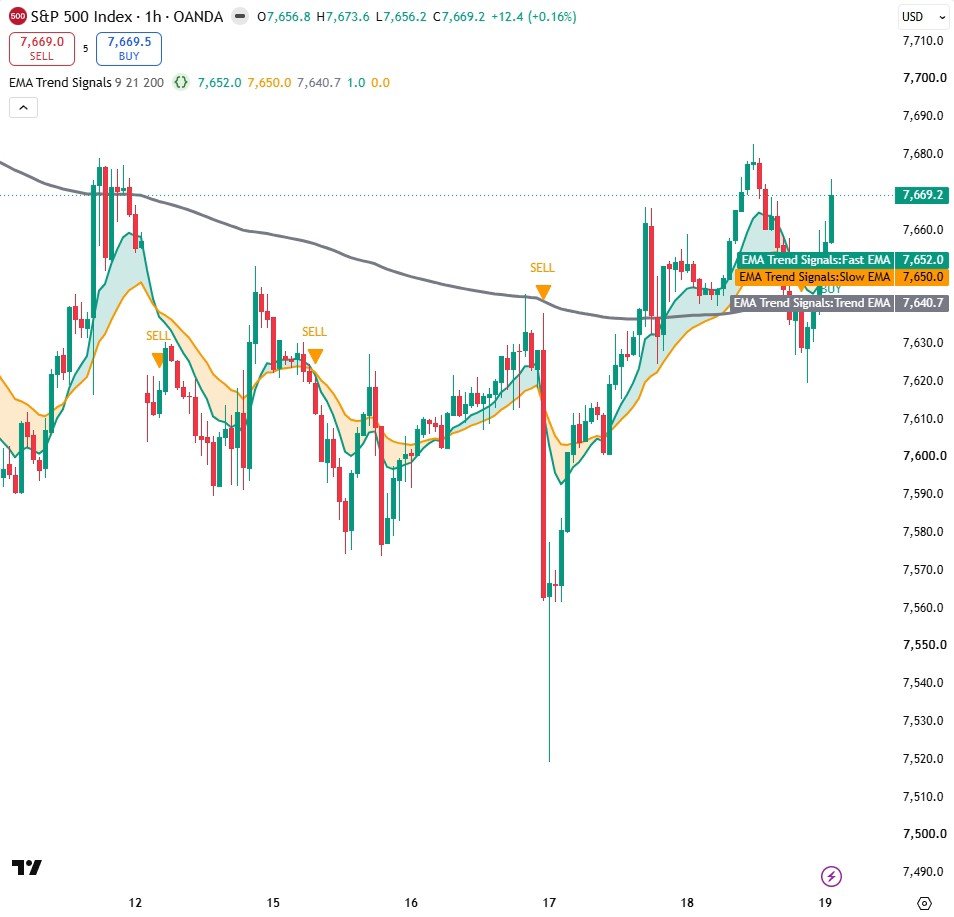
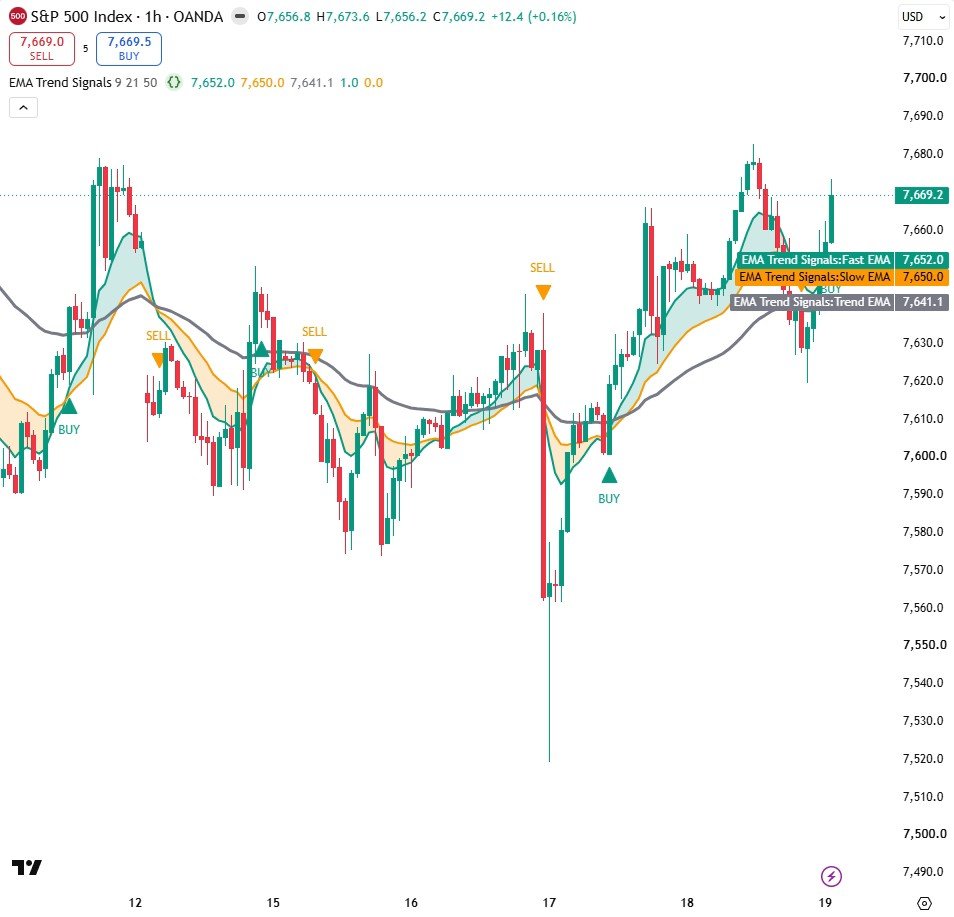
How it works
- Signals print only after the candle closes (barstate.isconfirmed), so they do not repaint.
- BUY needs a fast-over-slow EMA cross while price is above the Trend EMA; SELL is the mirror image.
- Create an alert on "EMA Trend Signals" and pick Buy or Sell, set to Once Per Bar Close.
Settings
| Setting | Default | What it does |
|---|---|---|
| Fast EMA | 9 | Short-term momentum line |
| Slow EMA | 21 | Crossover reference line |
| Trend EMA | 200 | Only trade in this direction |
Source code
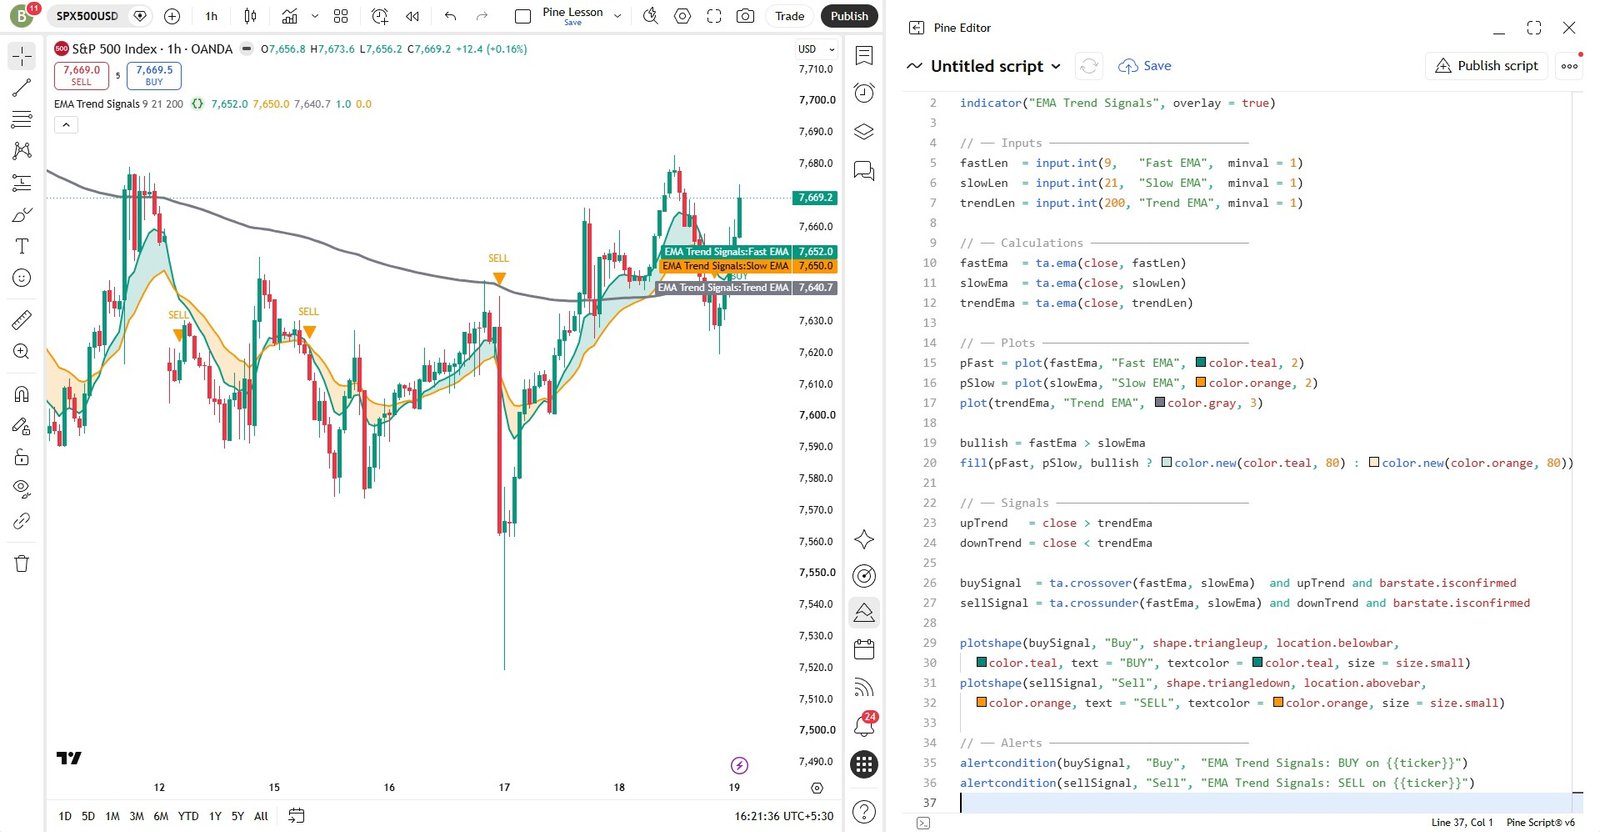
In TradingView: open the Pine Editor, create a new indicator, paste the code, then click "Add to chart".
//@version=6
indicator("EMA Trend Signals", overlay = true)

// ── Inputs ─────────────────────────────
fastLen  = input.int(9,   "Fast EMA",  minval = 1)
slowLen  = input.int(21,  "Slow EMA",  minval = 1)
trendLen = input.int(200, "Trend EMA", minval = 1)

// ── Calculations ───────────────────────
fastEma  = ta.ema(close, fastLen)
slowEma  = ta.ema(close, slowLen)
trendEma = ta.ema(close, trendLen)

// ── Plots ──────────────────────────────
pFast = plot(fastEma, "Fast EMA", color.teal, 2)
pSlow = plot(slowEma, "Slow EMA", color.orange, 2)
plot(trendEma, "Trend EMA", color.gray, 3)

bullish = fastEma > slowEma
fill(pFast, pSlow, bullish ? color.new(color.teal, 80) : color.new(color.orange, 80))

// ── Signals ────────────────────────────
upTrend   = close > trendEma
downTrend = close < trendEma

buySignal  = ta.crossover(fastEma, slowEma)  and upTrend and barstate.isconfirmed
sellSignal = ta.crossunder(fastEma, slowEma) and downTrend and barstate.isconfirmed

plotshape(buySignal, "Buy", shape.triangleup, location.belowbar,
  color.teal, text = "BUY", textcolor = color.teal, size = size.small)
plotshape(sellSignal, "Sell", shape.triangledown, location.abovebar,
  color.orange, text = "SELL", textcolor = color.orange, size = size.small)

// ── Alerts ─────────────────────────────
alertcondition(buySignal,  "Buy",  "EMA Trend Signals: BUY on {{ticker}}")
alertcondition(sellSignal, "Sell", "EMA Trend Signals: SELL on {{ticker}}")
Watch it built
Every line of this indicator is written and explained in this Pine Script v6 lesson.
Need a custom indicator or strategy?
Non-repainting Pine Script v6, backtested with real costs, alert and webhook ready. Fixed quote within 24 hours.