Snapshots
How it works
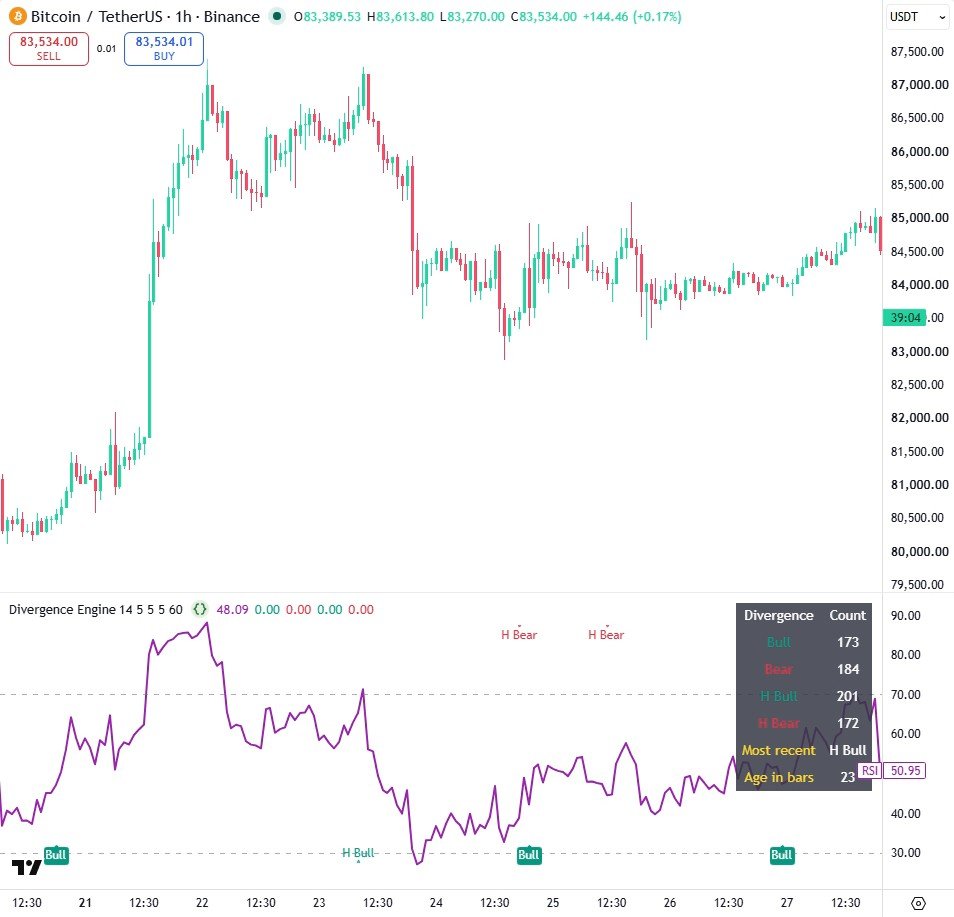
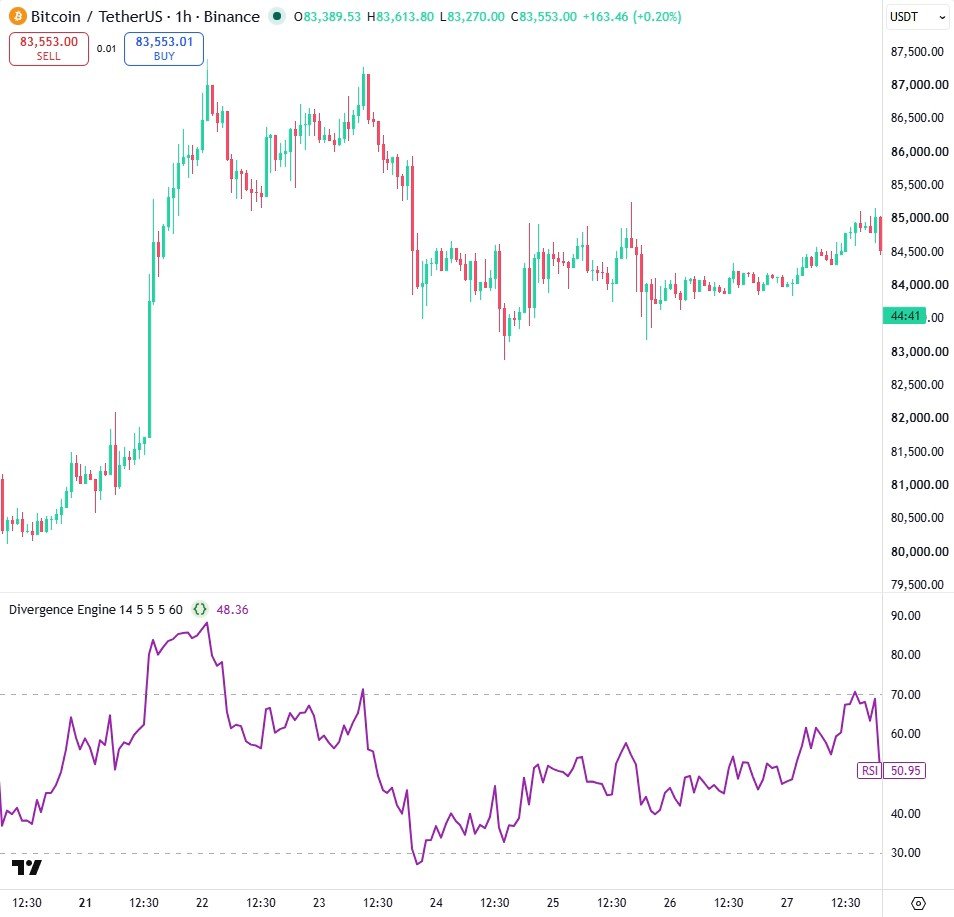
- ta.pivothigh and ta.pivotlow on the RSI find turning points, and the price at that same candle is read with the history operator.
- Each new pivot is compared with the nearest earlier pivot between the minimum and maximum gap to classify regular or hidden divergence.
- Markers appear on the confirmation bar, 5 bars after the pivot, instead of being shifted back, so the chart shows what could actually have been seen.
Settings
| Setting | Default | What it does |
|---|---|---|
| RSI length | 14 | RSI period |
| Pivot bars left / right | 5 / 5 | Bars either side that define a pivot |
| Min / Max bars between pivots | 5 / 60 | How far apart two pivots can be |
| Show hidden divergences | true | Also detect hidden bull and bear |
Source code
In TradingView: open the Pine Editor, create a new indicator, paste the code, then click "Add to chart".
//@version=6
indicator("Divergence Engine", overlay = false, max_bars_back = 500)

rsiLen = input.int(14, "RSI length", minval = 2)
lb = input.int(5, "Pivot bars left", minval = 1)
rb = input.int(5, "Pivot bars right", minval = 1)
minGap = input.int(5, "Min bars between pivots", minval = 1)
maxGap = input.int(60, "Max bars between pivots", minval = 2)
showHidden = input.bool(true, "Show hidden divergences")

rsi = ta.rsi(close, rsiLen)
plot(rsi, "RSI", color.new(color.purple, 0), 2)
hline(70, "Overbought", color.new(color.gray, 40))
hline(30, "Oversold", color.new(color.gray, 40))

type Pivot
    int bar
    float osc
    float price

var array<Pivot> lows = array.new<Pivot>()
var array<Pivot> highs = array.new<Pivot>()

pl = ta.pivotlow(rsi, lb, rb)
ph = ta.pivothigh(rsi, lb, rb)
bool bull = false
bool hBull = false
bool bear = false
bool hBear = false

if not na(pl)
    Pivot c = Pivot.new(bar_index - rb, pl, low[rb])
    n = array.size(lows)
    if n > 0
        for i = n - 1 to 0
            Pivot p = array.get(lows, i)
            gap = c.bar - p.bar
            if gap > maxGap
                break
            if gap >= minGap
                bull := c.price < p.price and c.osc > p.osc
                hBull := showHidden and c.price > p.price and c.osc < p.osc
                break
    array.push(lows, c)
    if array.size(lows) > 20
        array.shift(lows)

if not na(ph)
    Pivot c = Pivot.new(bar_index - rb, ph, high[rb])
    n = array.size(highs)
    if n > 0
        for i = n - 1 to 0
            Pivot p = array.get(highs, i)
            gap = c.bar - p.bar
            if gap > maxGap
                break
            if gap >= minGap
                bear := c.price > p.price and c.osc < p.osc
                hBear := showHidden and c.price < p.price and c.osc > p.osc
                break
    array.push(highs, c)
    if array.size(highs) > 20
        array.shift(highs)

plotshape(bull, "Bull", shape.labelup, location.bottom,
  color.new(color.teal, 0), text = "Bull", textcolor = color.white)
plotshape(bear, "Bear", shape.labeldown, location.top,
  color.new(color.red, 0), text = "Bear", textcolor = color.white)
plotshape(hBull, "H Bull", shape.triangleup, location.bottom,
  color.new(color.teal, 40), text = "H Bull", textcolor = color.teal)
plotshape(hBear, "H Bear", shape.triangledown, location.top,
  color.new(color.red, 40), text = "H Bear", textcolor = color.red)

var int nBull = 0
var int nBear = 0
var int nHBull = 0
var int nHBear = 0
var string lastType = "none"
var int lastBar = na
nBull += bull ? 1 : 0
nBear += bear ? 1 : 0
nHBull += hBull ? 1 : 0
nHBear += hBear ? 1 : 0
if bull or bear or hBull or hBear
    lastBar := bar_index
    lastType := bull ? "Bull" : bear ? "Bear" : hBull ? "H Bull" : "H Bear"

var table t = table.new(position.top_right, 2, 7,
  bgcolor = color.new(color.black, 15), border_width = 1)
row(r, name, val, col) =>
    table.cell(t, 0, r, name, text_color = col)
    table.cell(t, 1, r, val, text_color = color.white)

if barstate.islast
    age = na(lastBar) ? "-" : str.tostring(bar_index - lastBar)
    row(0, "Divergence", "Count", color.white)
    row(1, "Bull", str.tostring(nBull), color.teal)
    row(2, "Bear", str.tostring(nBear), color.red)
    row(3, "H Bull", str.tostring(nHBull), color.teal)
    row(4, "H Bear", str.tostring(nHBear), color.red)
    row(5, "Most recent", lastType, color.yellow)
    row(6, "Age in bars", age, color.yellow)
Watch it built
This script is written and explained step by step in the video lesson.
Need a custom indicator or strategy?
Non-repainting Pine Script v6, backtested with real costs, alert and webhook ready. Fixed quote within 24 hours.