Snapshots
How it works
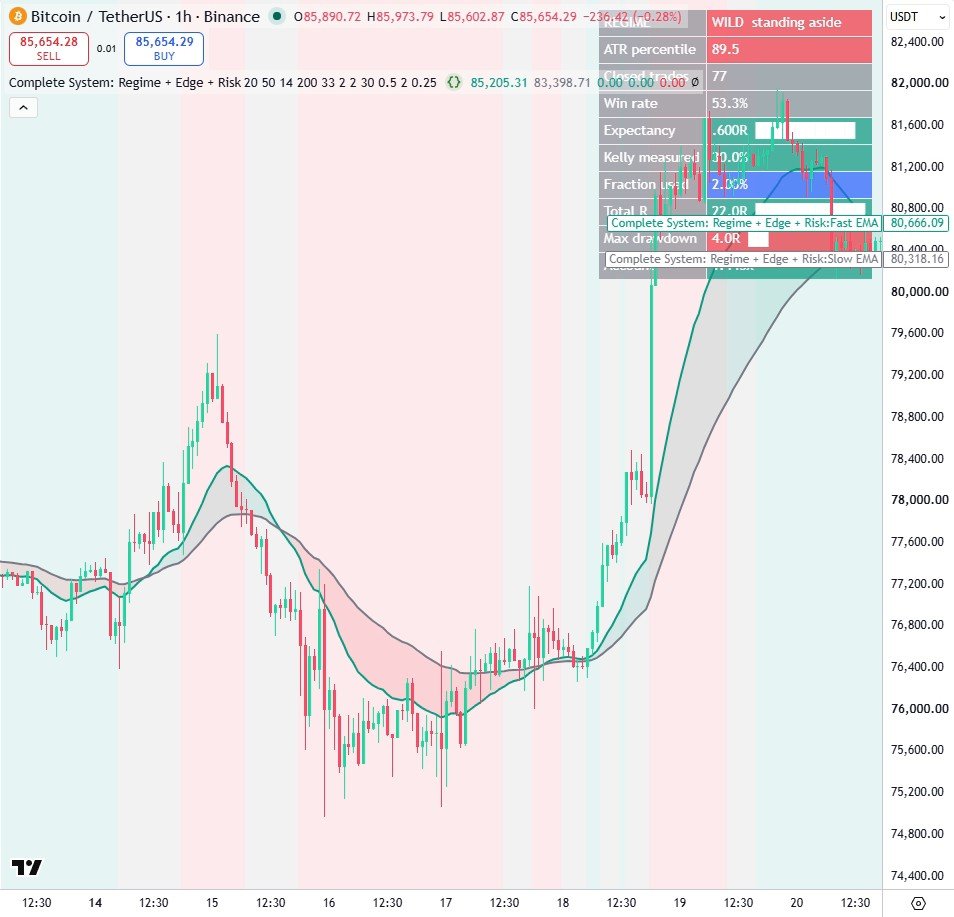
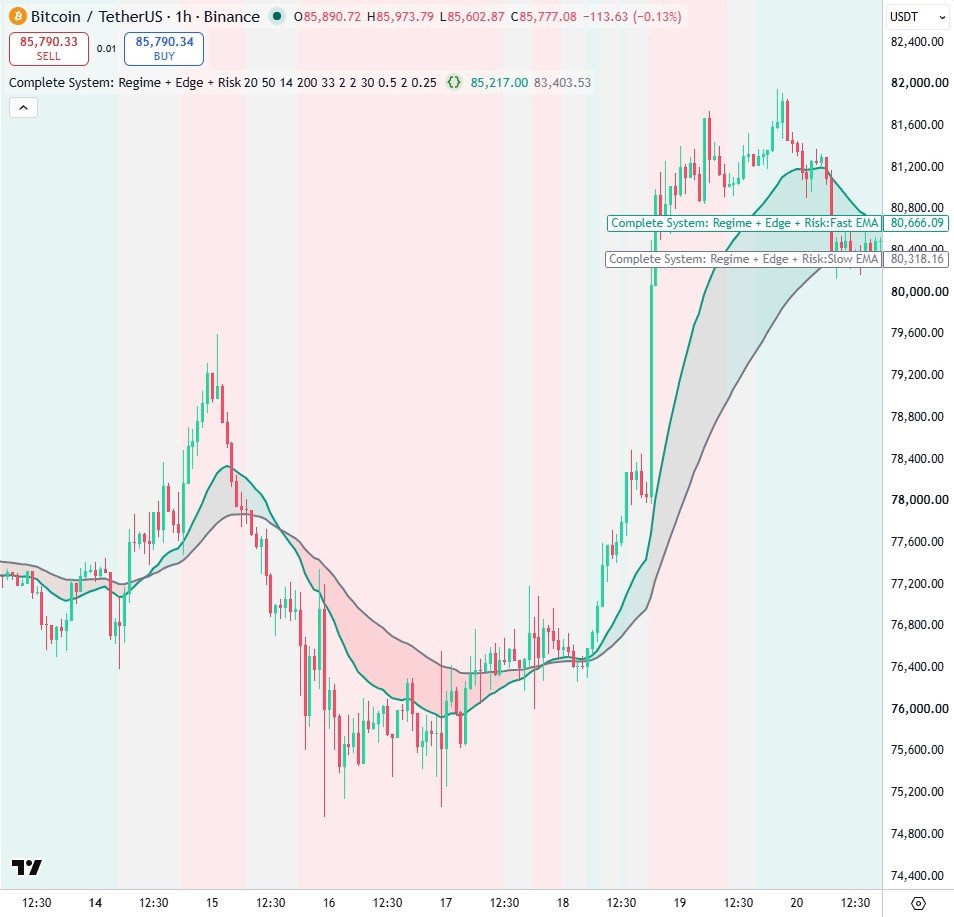
- The regime gate ranks current ATR against its own last few hundred readings and trades only in the quiet band.
- Kelly is measured from a rolling window of the strategy's own closed trades, then halved and capped, so sizing follows evidence rather than conviction.
- The backtest is run by hand in Pine and shown on the chart, so every number in the dashboard is traceable to a trade you can point at.
Settings
| Setting | Default | What it does |
|---|---|---|
| Fast EMA | 20 | Fast EMA length |
| Slow EMA | 50 | Slow EMA length |
| ATR length | 14 | Bars used for the ATR |
| Bars used to rank today's volatility | 200 | History the ATR percentile is ranked against |
| Trade only below this ATR percentile | 33 | The regime gate: quiet markets only |
| Stop, in ATRs | 2.0 | Stop distance, in ATRs |
| Target, in R | 2.0 | Target distance, as a multiple of the risk |
| Closed trades used to measure Kelly | 30 | Rolling window of the strategy's own trades |
Source code
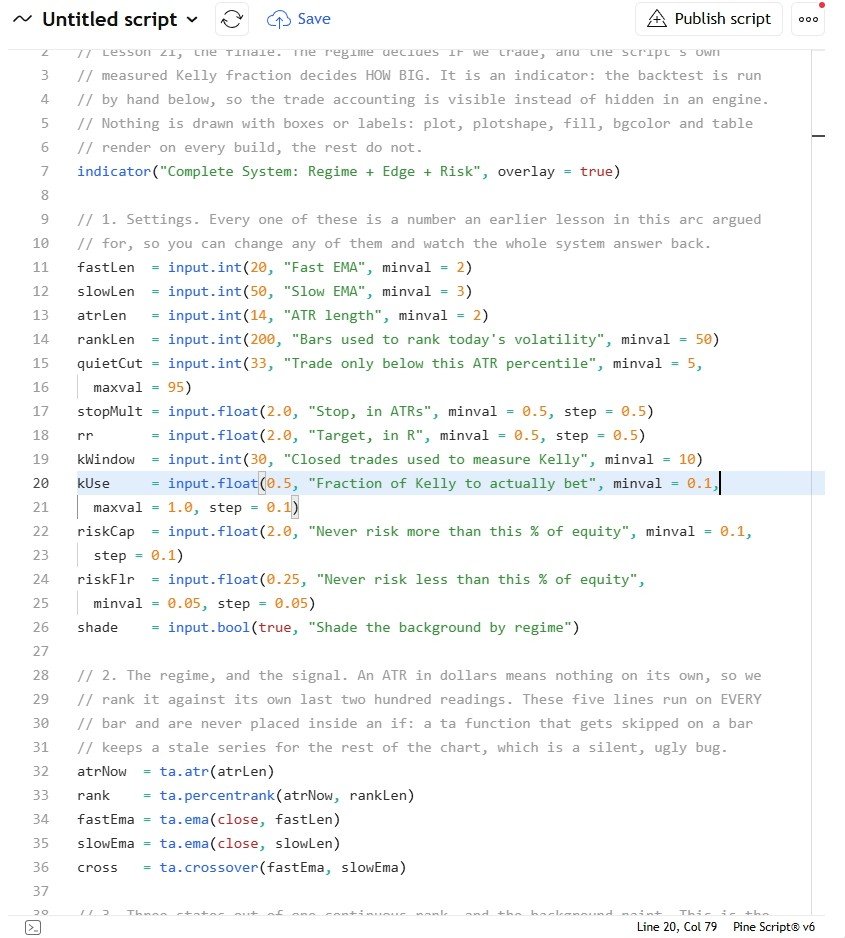
In TradingView: open the Pine Editor, create a new indicator, paste the code, then click "Add to chart".
//@version=6
// Lesson 21, the finale. The regime decides IF we trade, and the script's own
// measured Kelly fraction decides HOW BIG. It is an indicator: the backtest is run
// by hand below, so the trade accounting is visible instead of hidden in an engine.
// Nothing is drawn with boxes or labels: plot, plotshape, fill, bgcolor and table
// render on every build, the rest do not.
indicator("Complete System: Regime + Edge + Risk", overlay = true)

// 1. Settings. Every one of these is a number an earlier lesson in this arc argued
// for, so you can change any of them and watch the whole system answer back.
fastLen  = input.int(20, "Fast EMA", minval = 2)
slowLen  = input.int(50, "Slow EMA", minval = 3)
atrLen   = input.int(14, "ATR length", minval = 2)
rankLen  = input.int(200, "Bars used to rank today's volatility", minval = 50)
quietCut = input.int(33, "Trade only below this ATR percentile", minval = 5,
  maxval = 95)
stopMult = input.float(2.0, "Stop, in ATRs", minval = 0.5, step = 0.5)
rr       = input.float(2.0, "Target, in R", minval = 0.5, step = 0.5)
kWindow  = input.int(30, "Closed trades used to measure Kelly", minval = 10)
kUse     = input.float(0.5, "Fraction of Kelly to actually bet", minval = 0.1,
  maxval = 1.0, step = 0.1)
riskCap  = input.float(2.0, "Never risk more than this % of equity", minval = 0.1,
  step = 0.1)
riskFlr  = input.float(0.25, "Never risk less than this % of equity",
  minval = 0.05, step = 0.05)
shade    = input.bool(true, "Shade the background by regime")

// 2. The regime, and the signal. An ATR in dollars means nothing on its own, so we
// rank it against its own last two hundred readings. These five lines run on EVERY
// bar and are never placed inside an if: a ta function that gets skipped on a bar
// keeps a stale series for the rest of the chart, which is a silent, ugly bug.
atrNow  = ta.atr(atrLen)
rank    = ta.percentrank(atrNow, rankLen)
fastEma = ta.ema(close, fastLen)
slowEma = ta.ema(close, slowLen)
cross   = ta.crossover(fastEma, slowEma)

// 3. Three states out of one continuous rank, and the background paint. This is the
// entire regime model, and its simplicity is the point: the value is in conditioning
// on it, not in making it clever.
quiet  = not na(rank) and rank < quietCut
wild   = not na(rank) and rank >= 66
regCol = quiet ? color.teal : wild ? color.red : color.gray
bgcolor(shade ? color.new(regCol, 90) : na, title = "Regime")
pf = plot(fastEma, "Fast EMA", color.new(color.teal, 0), 2)
ps = plot(slowEma, "Slow EMA", color.new(color.gray, 0), 2)
fill(pf, ps, color.new(fastEma > slowEma ? color.teal : color.red, 88))

// 4. The system's memory of itself. Three floats describe the one open trade and
// riskAmt is the money staked on it, rBook holds every closed result converted into
// R multiples, eq is the account we are compounding by hand, and the last three
// floats track the equity curve in R so the drawdown is honest.
var float entry   = na
var float stop    = na
var float targ    = na
var float riskAmt = 0.0
var array<float> rBook = array.new_float(0)
var float eq = 10000.0
var float cumR = 0.0
var float peakR = 0.0
var float maxDdR = 0.0
var int seen = 0
var bool closedN = false
var bool wonN = false

// 5. Close the open trade, if this bar reached the stop or the target. A trade is
// worth exactly minus one R or plus rr by construction, so no division is needed to
// get comparable results, and the stake recorded at entry turns that R into money.
// The stop is checked first, which is the pessimistic reading of an ambiguous bar.
closedN := false
wonN := false
if not na(entry)
    if low <= stop or high >= targ
        r = low <= stop ? -1.0 : rr
        array.push(rBook, r)
        eq := eq + riskAmt * r
        cumR := cumR + r
        peakR := math.max(peakR, cumR)
        maxDdR := math.max(maxDdR, peakR - cumR)
        seen := seen + 1
        closedN := true
        wonN := r > 0
        entry := na

// 6. Expectancy and Kelly, measured from the last kWindow closed trades only. A Pine
// function is not allowed to assign to a global, so this one assigns to nothing at
// all: it reads the array it is handed and returns a tuple. The loop is guarded,
// because a Pine for loop whose start is above its end counts DOWNWARDS.
kellyFrom(arr, win) =>
    sz = array.size(arr)
    n = math.min(sz, win)
    wins = 0
    sumW = 0.0
    sumL = 0.0
    if n > 0
        for i = sz - n to sz - 1
            v = array.get(arr, i)
            if v > 0
                wins := wins + 1
                sumW := sumW + v
            else
                sumL := sumL + math.abs(v)
    losses = n - wins
    p = n > 0 ? wins * 1.0 / n : 0.0
    avgW = wins > 0 ? sumW / wins : 0.0
    avgL = losses > 0 ? sumL / losses : 0.0
    b = avgL > 0 ? avgW / avgL : rr
    expR = n > 0 ? (sumW - sumL) / n : 0.0
    kf = b > 0 ? p - (1.0 - p) / b : 0.0
    [n, p * 100.0, expR, kf]

// 7. Size the next trade. We bet a fraction of the measured Kelly number, then floor
// and cap it, because lesson 13 showed that full Kelly ruined eighteen per cent of
// accounts and twice Kelly ruined seventy seven per cent of them. Until the window
// has filled we simply risk one per cent, which is the honest thing to do when the
// system does not yet know anything about itself.
[nSeen, winPct, expR, kellyF] = kellyFrom(rBook, kWindow)
warm = nSeen < kWindow
rawFrac = kUse * kellyF
capFrac = math.min(math.max(rawFrac, riskFlr / 100.0), riskCap / 100.0)
useFrac = warm ? 0.01 : capFrac
stopDist = stopMult * atrNow
stake = eq * useFrac

// 8. The entry, which is two conditions and nothing else: the cross fired, and the
// regime gate is open. The stop and the target are set from this bar's close, and
// the stake measured above is stored with the trade so the exit can price it.
goLong = cross and quiet and na(entry) and stopDist > 0 and stake > 0
if goLong
    entry := close
    stop := close - stopDist
    targ := close + stopDist * rr
    riskAmt := stake
plotshape(goLong, "Entry", shape.triangleup, location.belowbar, color.teal,
  size = size.tiny)
plotshape(closedN and wonN, "Win", shape.circle, location.abovebar, color.teal,
  size = size.tiny)
plotshape(closedN and not wonN, "Loss", shape.xcross, location.abovebar,
  color.red, size = size.tiny)
plotchar(goLong ? useFrac * 100.0 : na, "Risk % used", "", location.top,
  color.teal)

// 9. The dashboard, and a bar drawn out of block characters so the numbers have a
// shape as well as a value. The width loop is guarded for the same downward-counting
// reason as the one above.
var table dash = table.new(position.top_right, 2, 10, border_width = 1)
row(r, k, v, bg) =>
    table.cell(dash, 0, r, k, text_color = color.white, text_size = size.normal,
      text_halign = text.align_left, bgcolor = color.new(color.gray, 40))
    table.cell(dash, 1, r, v, text_color = color.white, text_size = size.normal,
      text_halign = text.align_left, bgcolor = bg)
blocks(v, pk) =>
    w = int(math.round(10.0 * math.abs(v) / math.max(pk, 0.0001)))
    s = ""
    if w > 0
        for i = 1 to w
            s += "█"
    s

// 10. Report on the last bar only, so the table costs nothing while history loads.
// Read it top to bottom: is the gate open, how much has this system learned, what is
// it worth per trade, what is that worth allowed to bet, and where did the account
// finish after every one of those bets was actually paid for.
if barstate.islast
    regName = quiet ? "QUIET" : wild ? "WILD" : "NORMAL"
    gate = quiet ? "gate OPEN" : "standing aside"
    okCol = color.new(color.teal, 30)
    badCol = color.new(color.red, 30)
    dimCol = color.new(color.gray, 40)
    row(0, "REGIME", regName + "  " + gate, quiet ? okCol : badCol)
    row(1, "ATR percentile", str.tostring(rank, "#.0"), color.new(regCol, 30))
    row(2, "Closed trades", str.tostring(seen, "#"), dimCol)
    row(3, "Win rate", str.tostring(winPct, "#.0") + "%", dimCol)
    row(4, "Expectancy", str.tostring(expR, "#.000") + "R  " +
      blocks(expR, 0.6), expR >= 0 ? okCol : badCol)
    row(5, "Kelly measured", str.tostring(kellyF * 100.0, "#.0") + "%",
      kellyF > 0 ? okCol : badCol)
    row(6, "Fraction used", str.tostring(useFrac * 100.0, "#.00") + "%" +
      (warm ? "  (warming up)" : ""), color.new(color.blue, 30))
    row(7, "Total R", str.tostring(cumR, "#.0") + "R  " + blocks(cumR, 20.0),
      cumR >= 0 ? okCol : badCol)
    row(8, "Max drawdown", str.tostring(maxDdR, "#.0") + "R  " +
      blocks(maxDdR, 20.0), badCol)
    row(9, "Account", str.tostring(eq / 10000.0, "#.000") + "x",
      eq >= 10000.0 ? okCol : badCol)

// 11. Two alerts, because the thing you actually want your phone to say is not that
// a line crossed, but that the weather changed and the gate opened or shut.
alertcondition(quiet and not quiet[1], "Regime gate opened",
  "{{ticker}} is now QUIET: the system will take entries")
alertcondition(not quiet and quiet[1], "Regime gate closed",
  "{{ticker}} left the quiet regime: the system is standing aside")
Watch it built
This script is written and explained step by step in the video lesson.
Need a custom indicator or strategy?
Non-repainting Pine Script v6, backtested with real costs, alert and webhook ready. Fixed quote within 24 hours.