How Do I Know If My TradingView Indicator Repaints? A Testing Method
How to know if a TradingView indicator repaints: the four causes in Pine Script, a bar-replay and alert-log test you can run in an hour, and the fix for each.
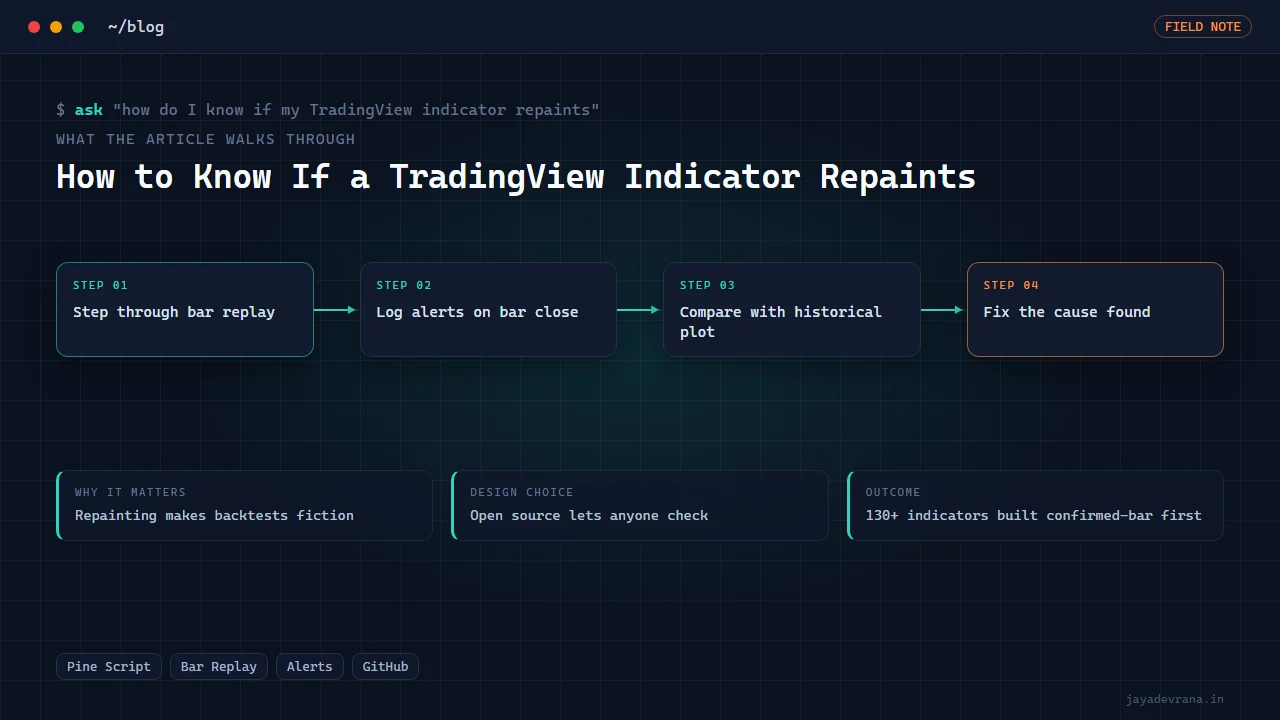
You know a TradingView indicator repaints when a signal that is visible on historical bars would not have been visible at the moment that bar was live. The practical test takes about an hour: open bar replay on the chart, step forward one bar at a time, and record when each signal first appears; then compare that list to the signals the indicator shows on the same bars once you return to the live chart. Any signal that appears in the historical view but appeared later, or not at all, during replay is a repaint.
There are four mechanical causes in Pine Script, and every repainting indicator I have examined falls into one of them: using the current unconfirmed bar's values, requesting higher-timeframe data that looks ahead, plotting pivot or zigzag points that are only known in hindsight, and intentionally offsetting plots backwards. Each has a signature you can spot in the source and a fix. This post walks through the test, the four causes and the fixes, and then describes how the 130-plus open-source Pine indicators I publish are built so that the question can be answered by reading the code rather than trusting me.
Why do TradingView indicators repaint in the first place?
Pine executes your script on every bar of history once, using each bar's final values, and then executes it again on every new tick of the live bar. On history, a bar's close is its close. On the live bar, the close is whatever the last trade was, and it changes until the bar ends. Any condition that reads the live bar's close, high or low can be true on one tick and false on the next; the arrow blinks in and out, and when the bar finally closes only the final state is kept. Historical bars never show the blinking, so the chart overstates how clean the signals were.
That is the simplest case. The others come from data that is not available until later, which is a more fundamental problem than tick-by-tick flicker, because no amount of waiting for the bar to close fixes it.
What are the four causes of repainting in Pine Script?
- Live-bar values. The script uses the current bar's close, high or low in a condition and plots on the same bar. The signal is provisional until the bar is confirmed. Signature in the source: conditions on the current bar with no confirmation check, and alerts set to fire on every tick.
- Higher-timeframe lookahead. The script requests a higher-timeframe value and uses it on lower-timeframe bars before that higher-timeframe bar has closed. On history, the completed higher-timeframe value is painted back across all the lower bars it spans, so the script "knows" the daily close at 10 in the morning. Signature: a higher-timeframe request without an explicit one-bar offset or a confirmed-bar guard, or with the lookahead option switched on.
- Hindsight pivots. Pivot highs and lows, zigzags and many support-and-resistance tools confirm a turning point only after a number of bars have passed. Plotting the pivot at the bar where it occurred, rather than at the bar where it was confirmed, makes signals look earlier than they were. Signature: a pivot function with a right-side length and a plot offset of the negative of that length.
- Negative plot offsets. Any plot shifted backwards in time draws information on bars that did not have it. Sometimes intentional for visual tools; always misleading for signals.
TradingView's own documentation on the subject at https://www.tradingview.com/pine-script-docs/concepts/repainting/ is thorough and worth reading alongside this list; it is the reference I point clients to when they want the official wording.
How do I run the bar replay test step by step?
- Pick a symbol and timeframe where the indicator produces frequent signals, so you get a meaningful sample in a short replay.
- Scroll back a few hundred bars and start bar replay from there.
- Step forward one bar at a time. Each time a new signal appears, note the bar time and the signal type. Also note if a signal that was there on the previous step disappears.
- Keep going for at least fifty signals.
- Exit replay, go to the same date range on the live chart, and list the signals the indicator shows there.
- Compare. Signals present in the historical view but absent, delayed or moved in your replay notes are repaints.
Two caveats. Bar replay feeds closed bars, so it will not expose live-bar flicker; for that, watch the indicator on a 1-minute chart for ten minutes and see whether arrows appear and vanish. And replay on a lower timeframe does not fully reproduce higher-timeframe lookahead on all plans, so for an indicator that uses higher-timeframe data you should additionally compare the plotted higher-timeframe value on an intraday bar against the actual higher-timeframe bar's close at that time.
How do I run the signal-log test if I cannot read the code?
Use the indicator's alerts as a recorder. Create an alert on the signal condition set to fire once per bar close, point it at any notification channel you can keep a history of, and let it run for a few days. Then compare the alert timestamps against the arrows on the chart. Signals on the chart with no matching alert, or alerts that arrived after the bar they are plotted on, are repaints. This test needs no access to the source and works on protected and invite-only scripts, which is exactly why I recommend it to clients evaluating paid indicators.
How do I fix each cause?
- Live-bar values. Evaluate the condition on the previous, confirmed bar, or guard the signal with the bar-confirmed state, and set alerts to once per bar close. The signal appears one bar later and never flickers.
- Higher-timeframe lookahead. Request the higher-timeframe value with an explicit one-bar offset so the script only sees completed higher-timeframe bars, and never enable lookahead for signals. I covered the production-grade pattern in the non-repainting multi-timeframe workflow.
- Hindsight pivots. Plot the pivot at the confirmation bar, or draw a line from the pivot bar to the confirmation bar so it is obvious when the information became available. For signals, use the confirmation bar's time.
- Negative offsets. Remove them from anything used as a signal. Keep them only for decorative plots and say so in the description.
The result is usually an indicator that looks slightly worse on the historical chart and behaves identically live, which is the only version worth trading or backtesting.
Does a non-repainting indicator mean the strategy is good?
No. It means the backtest is honest. An indicator can be perfectly non-repainting and still have no edge, and curve fitting is a separate problem I treat separately. Repainting is a correctness issue: it decides whether the historical chart is evidence at all. Indicators and strategies are educational and analytical tools, not financial advice, and removing repainting removes a lie, not a risk.
How I built this: 130+ Open-Source Pine Script Indicators
The reason I can be blunt about repainting is that my own Pine work is open. The 130-plus open-source Pine Script indicators are individual public repositories, one per script, covering supertrend systems, Smart Money Concepts and fair-value-gap tools, confluence scorers, opening-range breakouts, and many EMA, RSI and MACD variants, much of it originating from real Indian-broker and TradingView client work. Publishing at that scale took a pipeline, and the pipeline enforces the habits above:
- Script originates from a real job or a personal study. Each one started as something that had to work on a live chart for someone, which is where repainting gets noticed.
- Confirmed-bar discipline by default. Signal conditions in the collection are written against confirmed bars, higher-timeframe requests carry an explicit offset, and pivots are plotted at their confirmation bar. Where a visual element is intentionally offset, the header comment says so.
- Batch manifest tracks each script. A manifest records the script's name, version and publish state, so a fix to a repainting pattern can be applied across the family and tracked to completion rather than fixed in one repo and forgotten in ten.
- Automated repository creation. The pipeline creates an individual public repository per script with the source, a short description and the version tag. One script per repo means the code is small enough to read in one sitting, and the git history shows every change.
- Published and browsable. The whole set is browsable through a single filter on my GitHub profile, so anyone can open a script, search the source for the four signatures above and judge it without my involvement.
The design decision that matters most is openness itself. A protected indicator asks you to trust the author about repainting; an open one lets you check in two minutes. The outcome is a body of work that documents the range of trading logic I have implemented in Pine, and that doubles as a reference library for the non-repainting patterns when I take on client scripts.
FAQ
Is every indicator that changes on the live bar repainting?
The live bar updating tick by tick is normal and unavoidable; a moving average moves while the bar forms. Repainting in the harmful sense is when a signal or value on a closed historical bar differs from what was shown when that bar was live. Live-bar flicker becomes a problem only when alerts or decisions are made on it.
Can a strategy repaint even if the indicator does not?
Yes. Strategy-level settings such as calculating on every tick, filling orders on bar close, or using order sizes based on the current bar can make the tester's trade list differ from what would have happened live. Test the strategy's trade list in replay just as you test an indicator's signals.
Does using a higher timeframe always repaint?
No. A higher-timeframe value requested with a one-bar offset, or evaluated only on confirmed higher-timeframe bars, is stable. The repaint comes from using the current, still-forming higher-timeframe bar or from enabling lookahead on the request.
How do paid indicator vendors hide repainting?
Most commonly through hindsight pivots plotted at the pivot bar, and by showing performance tables computed on the historical chart only. The signal-log alert test exposes both because it records what the script knew at the time, not what it draws afterwards.
If you want an existing indicator audited for repainting or rebuilt so that it passes the replay and alert tests, tell me about it on the contact page.
Building something in this space? I ship trading automation, Pine Script, MQL5 EAs, and full-stack tools with source and docs.
Start a project →