How to Code Break of Structure and Change of Character in Pine Script
How to code break of structure and change of character in Pine Script: swing detection, sweep tracking, BOS vs CHoCH rules, and bar-level verification.
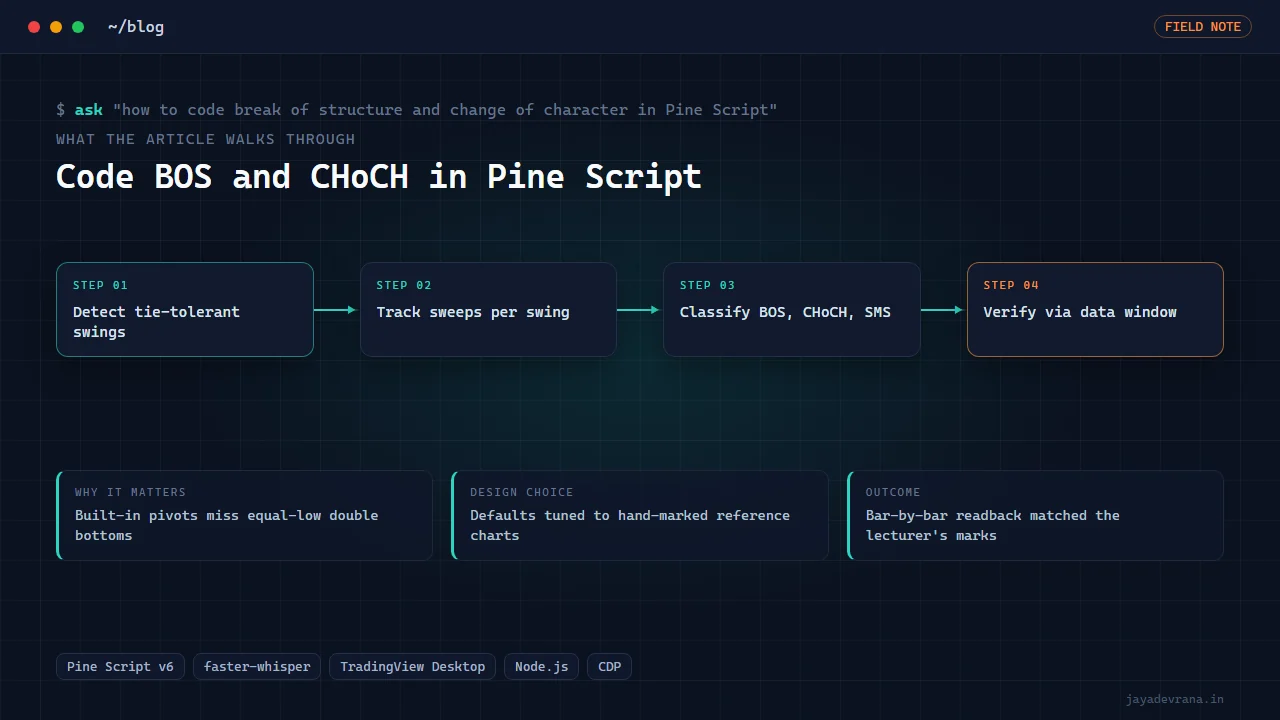
To code break of structure and change of character in Pine Script you build three layers: a swing detector that labels confirmed highs and lows, a structure tracker that remembers the most recent swing in each direction and the current trend, and an event classifier that fires a break of structure (BOS) when a closed bar takes out the last swing in the trend direction and a change of character (CHoCH) when a closed bar takes out the last swing against the trend. Every market structure indicator on TradingView is some version of those three layers; the differences are in how swings are detected, whether sweeps are distinguished from breaks, and how the trend flips.
I built one from an unusual source: a 43-minute Hindi lecture whose author defines these terms more precisely than most English SMC content, and whose follower had hand-marked monthly charts I could test against. That forced decisions a tutorial would gloss over, including writing my own swing detector because the built-in pivot function rejected a key double bottom. Here is the full logic in words, followed by how the indicator was verified bar by bar.
How do you detect swing highs and lows in Pine Script?
The standard approach is a pivot: a bar whose high is greater than the highs of N bars on each side is a swing high, confirmed N bars after it forms. Pine's built-in pivot functions do this, and for most indicators they are fine. Two things to understand:
- Confirmation lag. A swing with length 5 is only known five bars later. Your BOS can therefore only be evaluated against swings that were confirmed before the break bar, otherwise you are using the future.
- Strict inequality. The built-in detector requires the centre bar to be strictly higher than its neighbours. Two bars with identical highs, an equal-highs double top, produce no pivot at all. On monthly stock charts, where a tick of difference is common, that silently deletes exactly the swings traders care about.
Problem two is why I wrote a tie-tolerant swing finder: a bar qualifies as a swing low if no bar within N on either side is lower than it by more than a small tolerance, and when two bars tie, the later one is taken as the swing. That single change was the difference between reproducing the hand-marked charts and not.
What is the difference between BOS and CHoCH?
Both are a close beyond a prior swing. The difference is direction relative to the current trend:
- Break of structure continues the trend. In an uptrend, a close above the last swing high is a BOS; the trend stays bullish and the structure tracker updates its reference swings.
- Change of character opposes the trend. In an uptrend, a close below the last swing low is a CHoCH; it is the first sign that the trend may be flipping, and most implementations flip the trend state on it.
Implementation is a few comparisons on each closed bar: if trend is up and close exceeds the stored last swing high, record a BOS and move the reference; if trend is up and close is below the stored last swing low, record a CHoCH and set the trend down; mirror for a downtrend. Use the close, not the high or low, for the break test; a wick through a swing is a sweep, and sweeps deserve their own layer.
How do you tell a sweep from a real break?
This is the layer most free indicators skip, and the lecture I worked from makes it central. A fakeout, or sweep, is a bar that trades beyond a swing but is reclaimed, with the market closing back on the original side within a small number of bars (three in the source material). A break is a close through that holds.
The lecture's definitions go further and are worth encoding exactly:
- A break of market structure (BMS) is a fakeout sweep of a swing followed by a close through the intervening high or low on the other side. Its probability is rated higher when there is a rotation swing (an intermediate swing) between the sweep and the break, and lower when there is not, so the indicator classifies BMS-with-rotation and BMS-without-rotation separately.
- A shift of market structure (SMS) is two breaks against the old trend without a fakeout preceding them.
To track this, the indicator maintains for each recent swing a state: untouched, swept (wick beyond, reclaimed within three bars), or broken (close through). A sweep arms the setup; the subsequent close through the opposite intervening level completes the BMS. The classifier then checks whether a confirmed swing exists between the swept level and the broken level to attach the rotation flag.
Why do default settings matter so much for market structure?
Because the swing length decides what counts as structure at all. Length 2 on a monthly chart and length 10 on a 5-minute chart describe different markets. Most indicators ship a default by taste. For this one, the defaults were chosen by a test: the owner had hand-marked specific sweeps and breaks on two monthly stock charts, and the swing length and detector were tuned until both charts reproduced every marked event. The answer turned out to be a swing length of 2 with the tie-tolerant detector.
A second finding from that tuning: a 50 percent filter (ignore structure moves that do not retrace at least half of the prior leg) belongs only on the structure layer. Applying it to the sweep layer removed the very sweep the chart was marked around. Filters that sound sensible can delete the signal you are testing for, which is why the reference charts are more valuable than any theory.
How do you verify a structure indicator is correct?
Looking at the chart is not verification; it is a vibe check. The method that worked was to write hidden plots to the data window: a numeric BMS code per bar (zero for nothing, distinct codes for BMS with rotation, BMS without rotation and SMS), the swept level, and the broken level. Then, on TradingView Desktop, small scripts drive the Chrome DevTools Protocol to step through bars and read those data-window values back, so every event can be compared against the hand-marked reference without squinting at labels.
This approach generalises. Any indicator with discrete events can expose them as hidden plots, and any reference (a spreadsheet of expected events, a marked-up chart, a Python replica) can be compared against the readback. I use the same technique for multi-timeframe alert scripts, where it caught dedupe bugs that were invisible on the chart. If your event logic also feeds a strategy, make sure the structure flip and the order logic are evaluated on confirmed bars; the repaint traps in my Pine Script to production post apply here in full.
How I built this: BMS/SMS Market-Structure Indicator from a Hindi Trading Lecture
The BMS/SMS market structure indicator was built from source material rather than from existing SMC scripts, and the workflow reflects that:
- Transcribe the lecture. A local speech model transcribed the 43-minute video. One segment came back hallucinated and had to be re-run with voice-activity detection switched off before the rule statements could be trusted.
- Extract rule statements. The definitions of fakeout (sweep reclaimed within three bars), BMS with and without a rotation swing, and SMS (two breaks against the old trend without a fakeout) were written down as testable conditions.
- Detect swings with tie tolerance. The custom swing finder replaced the built-in pivot after an equal-lows double bottom on a reference chart was rejected by it.
- Track sweeps and classify events. Each swing carries a state; sweeps arm the setup; closes through the intervening level complete a BMS, with the rotation flag attached by checking for an intermediate swing; two trend-opposing breaks without a sweep classify as SMS.
- Plot verification codes. Hidden data-window plots expose the BMS code, swept level and broken level per bar.
- Compare against reference charts. Node scripts over the DevTools Protocol read the data window bar by bar on TradingView Desktop; swing length and filters were adjusted until both hand-marked monthly charts reproduced exactly. That is also where the 50 percent filter was moved off the sweep layer.
The design decisions were all forced by evidence: the tie-tolerant detector exists because a real chart demanded it, the defaults exist because two reference charts agreed on them, and the data-window readback exists because "it looks right" is not a test. The outcome is a Pine v6 indicator whose events match the lecturer's own markings on the charts his follower provided, with a verification path anyone can rerun.
FAQ
Should BOS use the candle close or the wick?
Close. A wick beyond a swing that closes back is a sweep, and conflating the two is the main reason structure indicators flip trend on every spike. Keep sweeps as a separate state so you can see both.
Why does my CHoCH fire too often on lower timeframes?
Your swing length is too short for the timeframe, so every minor pullback registers as a swing and every minor move breaks one. Raise the length or add a minimum leg size in ATR. Better still, pick a reference chart you trust and tune until it reproduces.
Can this indicator work with the built-in pivot function?
Yes for most markets, no for charts with frequent equal highs or lows, which includes many monthly stock charts and round-number-heavy instruments. The tie-tolerant detector is a small amount of logic and removes the problem entirely.
How do I turn structure events into alerts?
Fire an alert on the bar where the event code changes from zero, and put the event type, level and price in the message. Because detection is on closed bars, the alert arrives at the next bar open, which is the honest timing.
If you want a market structure indicator built from your own rules or source material and verified against your charts, tell me about it on the contact page.
Building something in this space? I ship trading automation, Pine Script, MQL5 EAs, and full-stack tools with source and docs.
Start a project →