How to Build a Liquidity Sweep Indicator in TradingView (Pine v6)
How to build a liquidity sweep indicator in TradingView: define levels, detect the wick-through-and-reclaim, confirm, and avoid the same-bar fill trap.
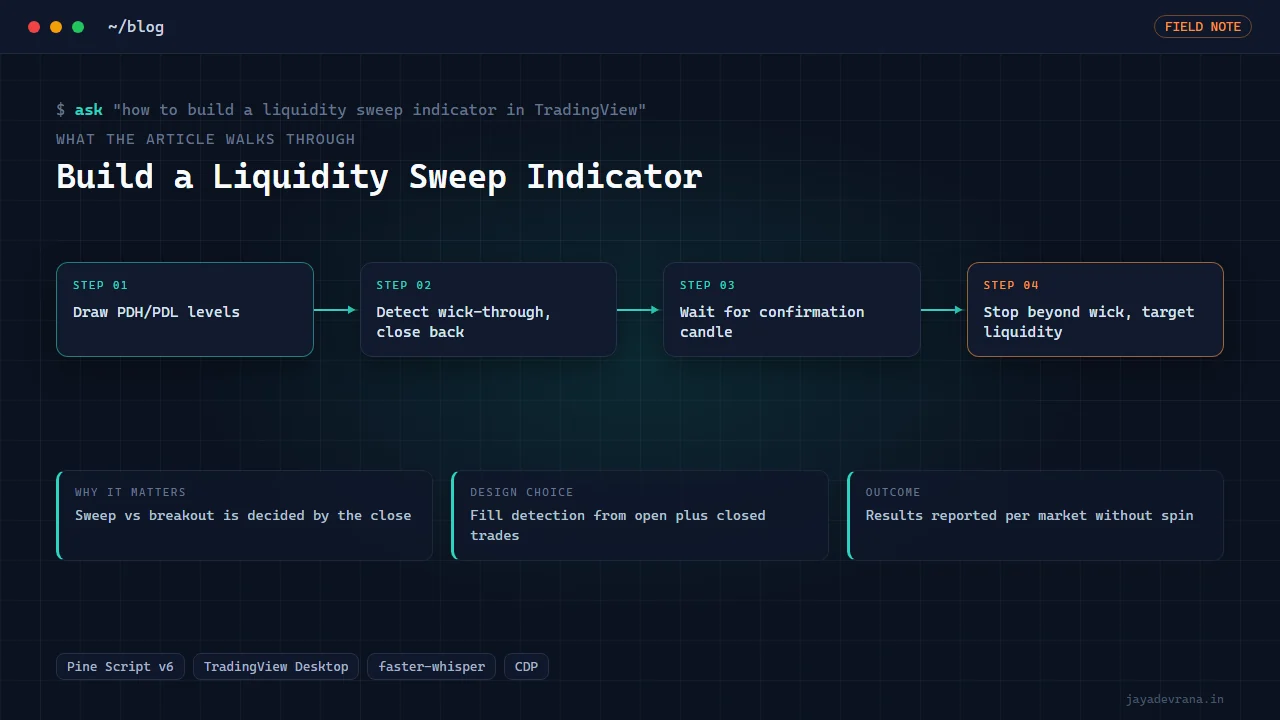
A liquidity sweep indicator in TradingView does three jobs in sequence: it draws the levels where resting orders cluster (previous-day high and low, session highs and lows, recent swing points, equal highs and lows), it detects the moment price pokes through one of those levels with a wick but fails to close beyond it, and it waits for a confirmation candle in the opposite direction before printing a signal. The sweep itself is the wick-through-and-reclaim; everything printed before the reclaim is just price touching a level.
I coded this as a Pine v6 strategy after researching what a well-known Indian educator actually teaches as his "sniper entry", then measured it across Nifty, gold and Bitcoin without decorating the results. Below is how the detection works step by step, which choices matter, and one Pine fill-detection bug that quietly ruins liquidity sweep backtests. As always with strategy posts: this is backtest engineering, not advice, and anyone trading it does so on their own account and risk.
What counts as liquidity in a sweep indicator?
Liquidity, in this vocabulary, means a price level where a lot of stop orders are likely sitting. Those stops become market orders when hit, which is why price often accelerates through the level and then reverses once they are consumed. The levels most indicators track:
- Previous-day high and low (PDH and PDL), the single most watched pair on intraday charts.
- Previous-week and previous-month extremes for swing traders.
- Session highs and lows, for example the Asian range before London opens.
- Recent swing highs and lows from a pivot detector.
- Equal highs or equal lows, two or more swings within a few ticks of each other, which traders treat as an especially obvious stop cluster.
In Pine, PDH and PDL come from a higher-timeframe request for the previous completed daily bar, fetched with lookahead disabled so the level is known at the start of the day and never changes during it. Swing levels come from a pivot function with a chosen left and right length, remembering that a pivot is only confirmed after the right-side bars have closed.
How do you detect a sweep rather than a breakout?
The difference between a sweep and a breakout is the close. A rule set that works:
- On each closed bar, check whether the bar's high exceeded a tracked level above (or the low undercut a level below).
- Check that the bar's close is back on the original side of the level. High above, close below, for a sweep of a high; low below, close above, for a sweep of a low.
- Optionally require that the excursion beyond the level was at most some fraction of ATR, so a huge spike through is treated differently from a shallow poke.
- Mark the level as swept and store the sweep bar's extreme, because that extreme becomes the stop for any trade.
- Reset or retire the level once it has been swept, or allow a count of sweeps per level if you want to track repeated attempts.
A bar that closes beyond the level is a break, not a sweep. Most false signals in homemade sweep indicators come from skipping rule two.
Why do liquidity sweep indicators need a confirmation candle?
Because a sweep alone tells you stops were consumed, not that the market agrees to reverse. The method I implemented requires a confirmation candle after the sweep bar: a candle that closes in the reversal direction, ideally with its body engulfing or at least closing beyond the sweep bar's midpoint. The entry is then placed at that confirmation candle's extreme (its high for a long after a low sweep), with the stop just beyond the sweep wick and the target at the opposite liquidity level, for example PDH after a PDL sweep.
Waiting costs you some of the move. It also removes the large class of sweeps that continue straight through on the next bar. In the strategy's measured results the confirmation requirement was what kept the default settings near breakeven on Nifty rather than firmly negative.
How should a sweep strategy choose its target?
Three options, in rising order of ambition: a fixed reward-to-risk multiple from the stop distance, the opposite liquidity level, or a structure target such as the most recent swing in the reversal direction. The educator's method uses opposite liquidity, which has a clean logic (price ran one pool of stops and should now run the other) and a practical problem: on a wide day the opposite level can be six or eight times the stop distance away and is rarely reached, so the win rate collapses and the average loser dominates.
Adding a structure bias helped in my tests: only take long sweeps when the higher-timeframe structure is already bullish, and vice versa. That is one input in the strategy and it materially changed the profit factor on all three markets, though not enough to make the Nifty result exciting.
What is the same-bar fill trap in Pine strategies?
This one is worth its own section because it affects any Pine strategy that enters on a stop order and can hit its stop loss on the same bar. The naive way to detect "a new trade filled" is to compare the current position size with the previous bar's. But if a stop entry fills and the stop loss is hit within the same bar, the position size is back to zero at the close, the comparison says nothing happened, your logic does not cancel the entry order, and the stop entry refills at the same price on the next bar, and the next, each time losing the same stop. The tester shows a staircase of identical losses that never existed.
The fix is to detect fills from the change in open trades plus the change in closed trades, which captures a round trip inside one bar. Once I made that change, the gold results changed noticeably and the Nifty ones moved toward breakeven. If you are migrating older scripts to v6, this pairs with the exit-ordering issues I describe in my v5 to v6 migration guide.
How I built this: Liquidity-Sweep Sniper Strategy (Booming Bulls Method) in Pine v6
The liquidity-sweep sniper strategy began with a different question than I expected. A well-known Indian trading educator had just placed second in a televised crypto trading cup, and the brief was to code "the strategy he won with". Research corrected that brief: no winning strategy was spoken during the contest. What he teaches publicly is the sniper entry described above, plus a prop-firm variant built on a 30-minute wait after the open, an inside-body candle and a 70/30 rule for partial exits.
- Source the rules. Public talks were transcribed with a local speech model and the rule statements extracted verbatim, so the strategy encodes what was said, not a paraphrase.
- Encode both modes. The sweep mode (PDH/PDL wick sweep, no close beyond, confirmation candle, entry at its extreme, stop beyond the wick, target at opposite liquidity) and the prop-firm inside-bar mode were written as one Pine v6 strategy with inputs for structure bias, which level sets to track and the target method.
- Measure on TradingView Desktop. The strategy was loaded over the Chrome DevTools Protocol and the Strategy Tester report read back programmatically, then cross-checked on a second charting engine.
- Report per market without spin. Defaults were near breakeven on three years of Nifty 15-minute, improved but still thin with structure bias and opposite-level targets, and around a 1.25 profit factor on ten months of gold at the default. One figure that appeared in an earlier README did not reproduce and is marked as not quotable.
- Fix the fill detection. The same-bar open-and-close bug above was found during verification and corrected.
- Record the walkthrough. A 16-minute on-chart video walks the contest hour on a 1-minute ETH chart, replays three real gold trades bar by bar, and shows the tester on all three markets.
The decisions that shaped it: correct the brief on facts rather than build a myth, state every result per market including the ones that disappoint, and document the Pine trap so the next strategy does not repeat it. The outcome is an honest implementation of a popular method with numbers attached, which is rarer than it should be.
FAQ
Does a liquidity sweep indicator repaint?
It should not if you detect on closed bars and fetch higher-timeframe levels from the previous completed candle with lookahead off. Indicators that draw the sweep on the live bar repaint constantly, because the wick can turn into a close-through before the bar ends.
Which timeframe works best for sweeps?
The method is taught on 5 and 15-minute charts against daily levels. Lower timeframes produce more sweeps and more noise; the 15-minute Nifty test was the one I used as the benchmark precisely because it is what most followers trade.
Can I get alerts for sweeps instead of a strategy?
Yes. The same detection logic in an indicator with an alert call on the confirmation bar gives you a sweep alert without any order logic. Put the level, direction and sweep price in the alert message so you can act on it without opening the chart.
Is the Booming Bulls method profitable?
On my measured data: near breakeven on Nifty at defaults, thin with filters, modestly positive on ten months of gold. Those are backtest numbers over limited windows, not a verdict on anyone's live trading, and they are exactly as reliable as any other backtest.
If you want a sweep indicator or strategy built and measured honestly on your market, tell me about it on the contact page.
Building something in this space? I ship trading automation, Pine Script, MQL5 EAs, and full-stack tools with source and docs.
Start a project →