How Do Invite-Only TradingView Indicators Actually Work? A Teardown
How invite-only TradingView indicators actually work: the access list, protected source, and what a pixel-verified replica found inside one sold as AI.
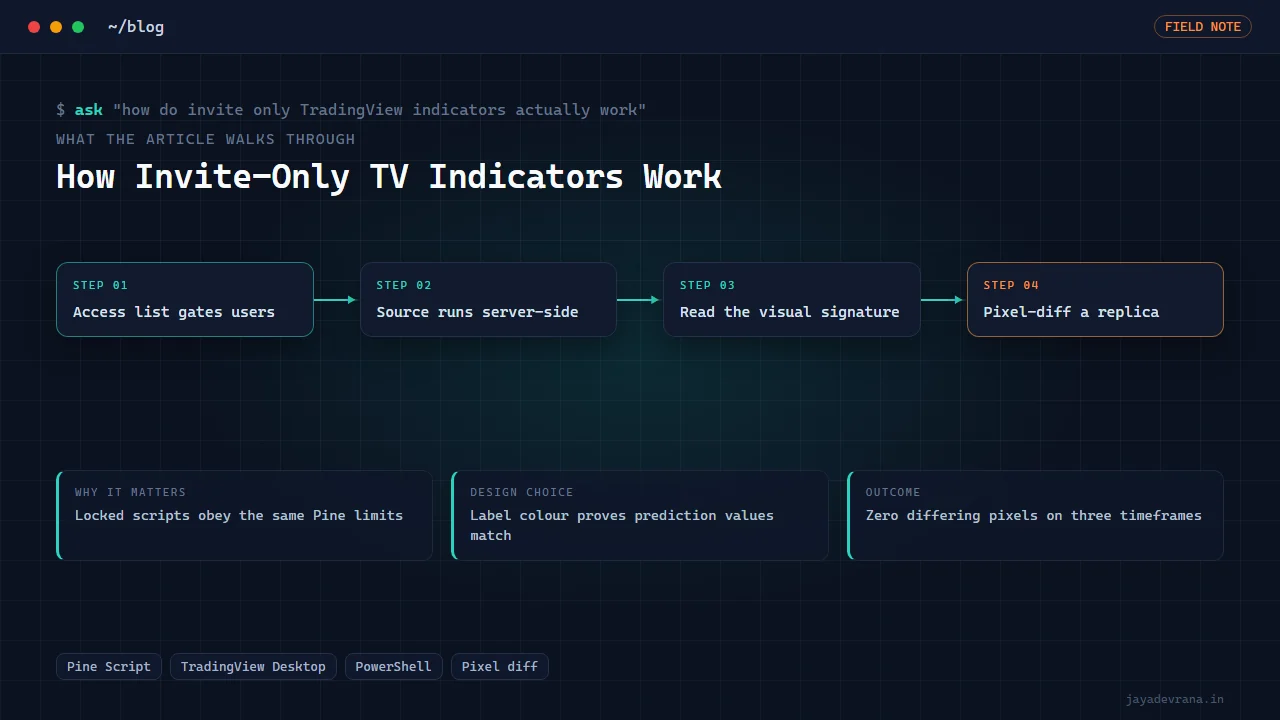
Invite-only TradingView indicators work through two separate mechanisms: an access list that the script author manages, which decides whose account can add the script to a chart, and source protection, which means the Pine code runs on TradingView's servers and the user only ever receives the plotted output. There is no licence file, no key check inside the code and no copy of the script on your machine. When the author removes your username from the list, the script simply stops being available to you. Everything the indicator does is still ordinary Pine Script subject to the same limits as any public script; the invite-only wrapper changes who can see it, not what it can compute.
That last point is the one worth dwelling on. Because the engine is the same, an invite-only indicator can only ever be some combination of things Pine can do, and in practice many are recombinations of well-known open-source components with new styling and a confident name. I verified this the hard way on one sold under an AI label, by rebuilding it from open-source parts until the two charts differed by zero pixels. Here is how the access model works, how to think about what is behind a locked script, and how that replica was proven.
What is the difference between invite-only and protected scripts?
TradingView has several publication visibilities, and the terms get mixed up:
- Open-source: the code is visible to anyone, and anyone can copy it.
- Protected: the script is listed publicly and anyone can add it, but the source is hidden.
- Invite-only: the source is hidden and only usernames on the author's access list can add it. This is the model for paid indicators.
- Private: not listed at all; the author shares a link.
Invite-only is simply protected plus an allow list. The author maintains the list in their script's management page, adding usernames when someone pays and removing them when access lapses. TradingView's own description of the publication types is at https://www.tradingview.com/support/solutions/43000482573/.
How does the access list enforce who can use the indicator?
Entirely on TradingView's side. When you open the indicator browser, invite-only scripts you are on the list for appear in your "Invite-only scripts" section. Add one to a chart and the server compiles and runs it for you, streaming the plot values to your browser the same as any other indicator. Your username is checked when you add it and on each load; if it is no longer on the list, the script disappears from your charts with a notice.
Some authors add their own expiry logic inside the script, for example a hard-coded date after which the script plots nothing or paints a warning. That is a convenience for the author, not a security boundary; the access list is what actually gates use. Authors can also set a per-user expiry date on the list itself.
Can anyone see or copy the source of an invite-only indicator?
No. The code never leaves TradingView's servers; your browser receives computed series and drawing instructions, not Pine source. There is no decompiler because there is nothing to decompile on the client. What is visible is the output: every plotted line, every label, every fill colour, every table cell, and the input names and defaults in the settings dialog (unless the author hides them). That visible output is a lot of information. Which brings us to the part that matters for anyone paying for one of these.
What is usually inside a locked "AI" indicator?
Pine has no machine-learning library, no model training and no external data access. Any "AI" or "machine learning" claim in a Pine indicator therefore refers to one of a handful of things implementable in a few hundred lines: a k-nearest-neighbour classifier over a small feature set, a simple kernel regression, a logistic-style weighting of indicators, or just a renamed moving-average crossover. The best-known open-source example is the Lorentzian Classification script, a nearest-neighbour classifier with a kernel regression line, which has been copied and restyled into countless paid products.
A reliable way to tell what a locked indicator is built from is to read its visual signature:
- A regression-like smooth line that hugs price and changes colour on slope is almost always a kernel estimate.
- Labels that appear at bar close with a colour gradient often encode a classifier's vote total.
- Trailing stop lines that ratchet and flip with coloured fills are typically a Chandelier Exit or SuperTrend.
- A corner table of RSI or trend values across timeframes is a multi-timeframe table, available in dozens of free scripts.
Once you can name the components, you can usually find them open-source and recombine them. If you are trying to achieve the same output in your own code rather than reverse a product, my guide to fixing AI-generated Pine that will not compile is the more useful read.
How can you prove a replica matches the original?
Side-by-side eyeballing is not proof. The method I used is pixel comparison on the actual TradingView desktop app:
- Load the original and the candidate replica on the same chart, same symbol, same timeframe, same scale.
- Toggle visibility so only one is shown, screenshot, toggle, screenshot again.
- Compute a pixel difference between the two screenshots; any non-zero region is a discrepancy.
- Zoom the discrepancy with nearest-neighbour magnification and probe the exact colours.
- Adjust style constants (line width, transparency, label colour mapping) and repeat until the difference image is empty.
This catches things you cannot see at normal zoom: a line one pixel wider, a fill at a different transparency, a label a shade off. It is also stronger than it looks, as the build section explains, because some colours encode computed values.
How I built this: Pixel-Verified Replica of an Invite-Only "AI" Indicator
The pixel-verified replica targeted a locked indicator sold under a smart-AI branding. The task was to find out what it was and reproduce it from open-source parts without copying anything from the original, which was never accessible anyway. The workflow:
- Read the visual signature. The kernel regression line, the gradient-coloured buy and sell labels, the ratcheting stop lines with state fills and the multi-timeframe RSI corner table pointed at three known open-source scripts: Lorentzian Classification, Chandelier Exit and an MTF RSI table.
- Compose at stock defaults. The three were combined in one script with every input left at its open-source default, on the hypothesis that the product was a straight stack.
- Load both on the same chart. Original and replica on weekly, daily and hourly charts, toggled for screenshots.
- Pixel-diff and probe. Differences were isolated region by region. Several non-default style settings had to be measured rather than assumed: a wider kernel line, specific transparencies on the stop lines and fills, and the order of inputs so that the status line read the same.
- Iterate to zero. Style constants were adjusted until the diff was empty on all three timeframes.
The decisive evidence is the label colour. In Lorentzian Classification, the buy label's colour is computed from the prediction total of the nearest-neighbour vote. An exact colour match on every label therefore proves the k-nearest-neighbour output matches value for value, not merely that the signals land on the same bars. That is a much stronger claim than "looks the same".
Two design notes. The work was done with Win32-level automation of the TradingView desktop app (screenshots, pixel diffs, magnification and colour probes) before I discovered the DevTools route, and those pixel-compare helpers remain useful for any replica verification. And the rule throughout was that nothing from the locked source was used, because nothing could be; the replica is three open-source layers and measured styling. The outcome: zero differing pixels on three timeframes, and a clear answer to what the paid "AI" indicator was.
FAQ
Is it legal to replicate an invite-only indicator?
Reimplementing publicly described logic from open-source components in your own code is normal engineering. Copying someone's source without permission is not, and in this case was never possible. Branding and names are separate matters; a replica for your own use should not borrow those. I am describing engineering practice, not giving legal advice.
Can an invite-only indicator steal my data or place trades?
No. Pine runs on TradingView's servers and has no access to your account, broker connections or browser. The worst a script can do is plot misleading things.
How do I know if a paid indicator repaints?
Watch it live for a session and compare what it painted in real time with what the historical chart shows afterwards, or use bar replay. A label that appears mid-bar and vanishes, or a signal that historically sits at a perfect turn, is a repaint. Locked source does not hide repainting from a patient observer.
Should I buy invite-only indicators at all?
That is a personal decision. My suggestion is to ask what the indicator could possibly be computing given Pine's limits, check whether open-source equivalents exist, and judge the price against that rather than against the marketing.
If you want an indicator verified, replicated from open parts, or built from scratch for your own rules, tell me about it on the contact page.
Building something in this space? I ship trading automation, Pine Script, MQL5 EAs, and full-stack tools with source and docs.
Start a project →