Is It Possible to Backtest Millions of Indicator Combinations? (GPU)
Is it possible to backtest millions of indicator combinations? Yes: a GPU sweep runs 2.45 billion three-indicator systems in minutes; most winners are noise.
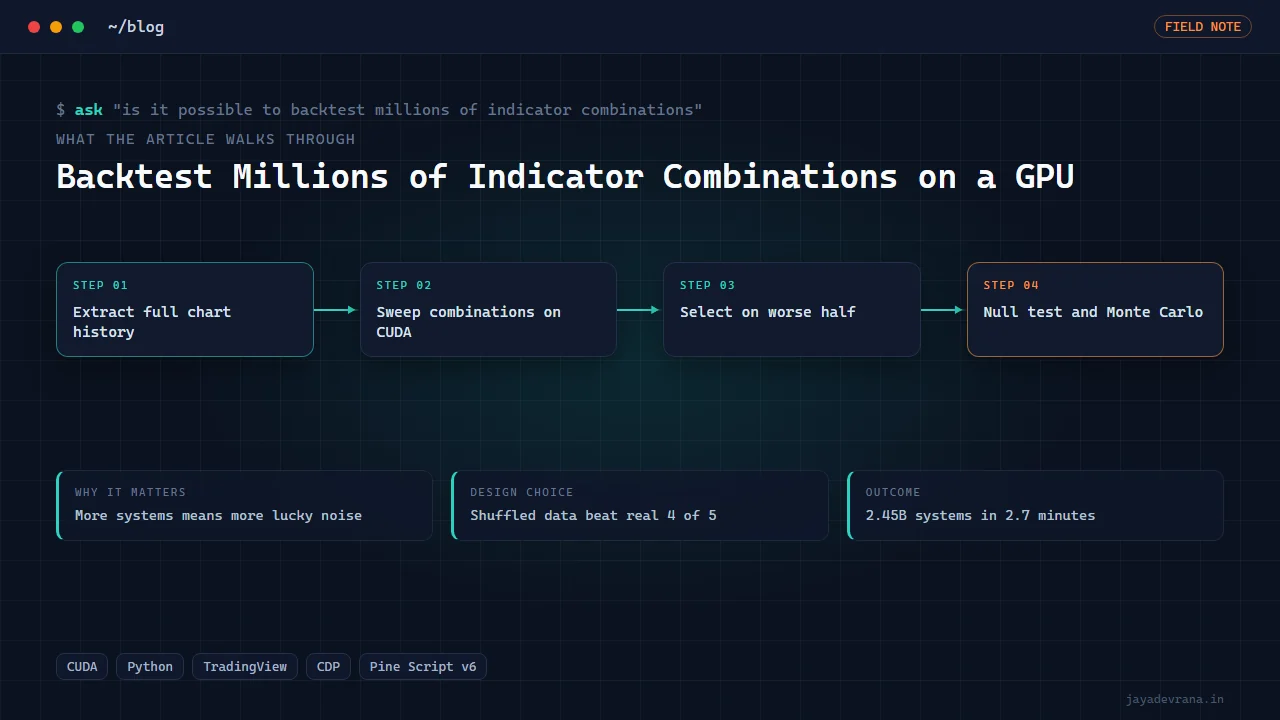
Yes, it is possible to backtest millions of indicator combinations, and with a consumer graphics card you can go well past millions. The method is to precompute every indicator variant once as an array over the bars, then let the GPU evaluate every combination of those arrays as a trading rule in parallel, with costs applied, producing a performance number per combination. On a single RTX-class card I have swept 2.45 billion unique three-indicator systems over fifteen thousand bars in about two and a half minutes.
The harder truth is that the ability to test billions of systems makes the selection problem worse, not better. With enough combinations, something will look spectacular on any series, including a random one. So the useful question is not "can I backtest millions of indicator combinations" but "how do I pick from billions without picking noise", and the second half of this post is about that. The featured project is the pipeline I built that goes from a TradingView chart to a GPU sweep to a Pine strategy that matches the Strategy Tester.
Why is a brute-force sweep even feasible?
Three facts make it tractable:
- Indicators are cheap to precompute. A library of indicator variants, say every moving-average type and length, every oscillator and threshold, every channel and multiplier, is a few thousand arrays. Computing them once over fifteen thousand bars takes seconds.
- Combinations are embarrassingly parallel. A three-indicator system is a rule like "enter when A is bullish and B confirms, exit when C flips". Each combination's backtest is independent of every other, which is exactly the workload a GPU with thousands of cores is built for.
- The per-system backtest is simple arithmetic. Walk the bars, track a position, apply the entry and exit conditions, charge spread and commission, accumulate returns. No branching on external state, no API calls.
With 2,449 indicator variants across 21 families, the number of unique three-indicator systems is in the billions. The GPU evaluates them in batches, writing back a handful of statistics per system: net return, drawdown, trade count, and the figures needed for robustness checks later.
How do I get enough historical data to make the sweep meaningful?
This is where most retail attempts fail before they start. TradingView shows you a chart with years of history, but the export tools give you a limited window, and the symbol a client wants swept is rarely the one on the chart. My pipeline solves it by driving TradingView Desktop over the Chrome DevTools Protocol: it switches to the requested symbol and timeframe, pages backwards until the server reports end of data, reads every bar, and then restores the original chart so the user's layout is untouched. On the account I use that meant 21,370 bars of 5-minute gold, or daily SPY back to 1993. Bars are written to a file and integrity-checked for gaps and duplicates before the sweep sees them.
If you do not want to automate the chart, broker APIs and data vendors are the alternative; the sweep does not care where the bars come from, only that they are complete and honestly timestamped.
How do I avoid picking the luckiest system out of billions?
This is the part that separates a research tool from a curve-fitting machine. Selection in my pipeline is deliberately pessimistic:
- Rank on the worse half. Split the history into halves and rank each system on its weaker half rather than its overall number. A system that only worked in one half drops out.
- Count plateau neighbours. For each candidate, look at the systems with adjacent parameter values. A true edge sits on a plateau where neighbours also perform; a lucky spike has poor neighbours.
- Re-run the winner on a CPU oracle. A slow, obviously correct reference implementation recomputes the top candidates. If the GPU and the oracle disagree, there is a bug, not an edge.
- Null-data test. Rebuild the price series from its own shuffled returns, which destroys any real structure while keeping the return distribution, and run the entire sweep again. The best system on shuffled data is the benchmark for "what luck achieves".
- Monte Carlo on trades. Bootstrap the winning system's trade sequence thousands of times and report drawdown percentiles rather than the single historical drawdown.
The null-data test is the cheapest rigorous proof available. On gold, four of five shuffled datasets produced an in-sample leader that beat the real data's in-sample leader. In other words, the top of a billion-system leaderboard on real gold was no better than the top of the same leaderboard on noise. Anyone selling the top result of a big sweep without that comparison is selling the data-mining artefact. For a deeper treatment of detection, see how to tell if a backtest is curve fitted.
What does the output look like, and can I trade it?
The output of a sweep done this way is a short list of robust settings with their worse-half performance, plateau width, oracle agreement, null-test margin and Monte Carlo drawdown percentiles. Those settings are then written into a Pine v6 strategy and attached to the chart, and the Strategy Tester's result is compared with the engine's. In my runs the delivered Pine matched the tester within 0.2 percent, which proves the sweep evaluated the same rules the trader will see.
Whether to trade it is a separate decision. A system that survives every check above still has a modest edge at best, with measured drawdowns the Monte Carlo makes uncomfortably concrete. Backtesting at scale is research engineering, not financial advice; whoever trades the result does so on their own account at their own risk.
How I built this: TradingView to 2.45-Billion-System GPU Backtest Pipeline
The TradingView to 2.45-billion-system GPU backtest pipeline began with a recurring client request: "backtest all available data on this symbol" while their chart sat on something else. It is packaged as a reusable skill so the whole run can be repeated on a new symbol with one instruction. The pipeline:
- Extract history over CDP. A zero-dependency Node driver connects to TradingView Desktop, switches symbol and timeframe, requests more data until end of data, reads every bar, and restores the original chart.
- Write and verify bars. The bars go to a file with an integrity check for ordering, gaps and duplicates.
- Sweep on CUDA. The engine computes the 2,449-variant, 21-family indicator library and evaluates all three-indicator combinations with spread and commission applied, roughly 2.7 minutes for 15,000 bars on a single GPU.
- Select pessimistically. Worse-half ranking, plateau counting and CPU-oracle agreement narrow billions to a few candidates.
- Quantify luck and drawdown. The null-data sweep on shuffled returns and a trade-bootstrap Monte Carlo produce the numbers that decide whether a candidate means anything.
- Generate and verify Pine. A Pine v6 strategy with the chosen settings is attached to the chart and checked against the Strategy Tester.
Two design decisions shaped it. First, the sweep is only as good as its scoring, so the skill's first real run was treated as a test of the engine; it caught four genuine scoring bugs before anything shipped. Second, the pipeline reports the null result next to the real result every time, because the honest conclusion on many symbols is that the leaderboard is noise, and a tool that cannot say so is not a research tool. The same engine later became the backtest mode inside my TradingView desktop copilot, streaming a live leaderboard while it runs.
The outcome is a repeatable path from any chart to a defensible answer about what a brute-force sweep does and does not find, with the Pine delivered and tester-matched when something survives.
FAQ
Do I need an expensive GPU?
No. The sweep is written for CUDA and runs on consumer RTX cards. A larger card finishes faster, but a mid-range one handles billions of combinations in minutes rather than hours. Without any GPU the same sweep on a CPU would take days, which is why the question used to be answered "no".
Can this work for multi-timeframe or options strategies?
Multi-timeframe is possible by precomputing higher-timeframe indicators aligned to the base bars with proper offsets, which adds complexity to the data step but not to the sweep. Options strategies need a different engine entirely because the instrument changes and pricing depends on more than the underlying's bars.
Is this the same as walk-forward optimisation?
Walk-forward is one robustness method; this pipeline uses worse-half ranking, plateau analysis, a null-data baseline and Monte Carlo, which together address the same concern from different angles. Walk-forward can be layered on top for the final candidates.
How many systems from a sweep usually survive?
Often none that beat the null test by a convincing margin. When something survives, it is typically a small family of neighbouring settings with a modest edge, not a single spectacular result. That outcome is the pipeline working as intended.
If you have a symbol and a question about what a full sweep would show, describe it on the contact page and I will tell you what the run involves.
Building something in this space? I ship trading automation, Pine Script, MQL5 EAs, and full-stack tools with source and docs.
Start a project →