How to Tell If a Backtest Is Curve Fitted: 6 Tests That Expose It
How to tell if a backtest is curve fitted: holdout, walk-forward, parameter plateau, neighbour survival, matched null baseline and tester parity; real example.
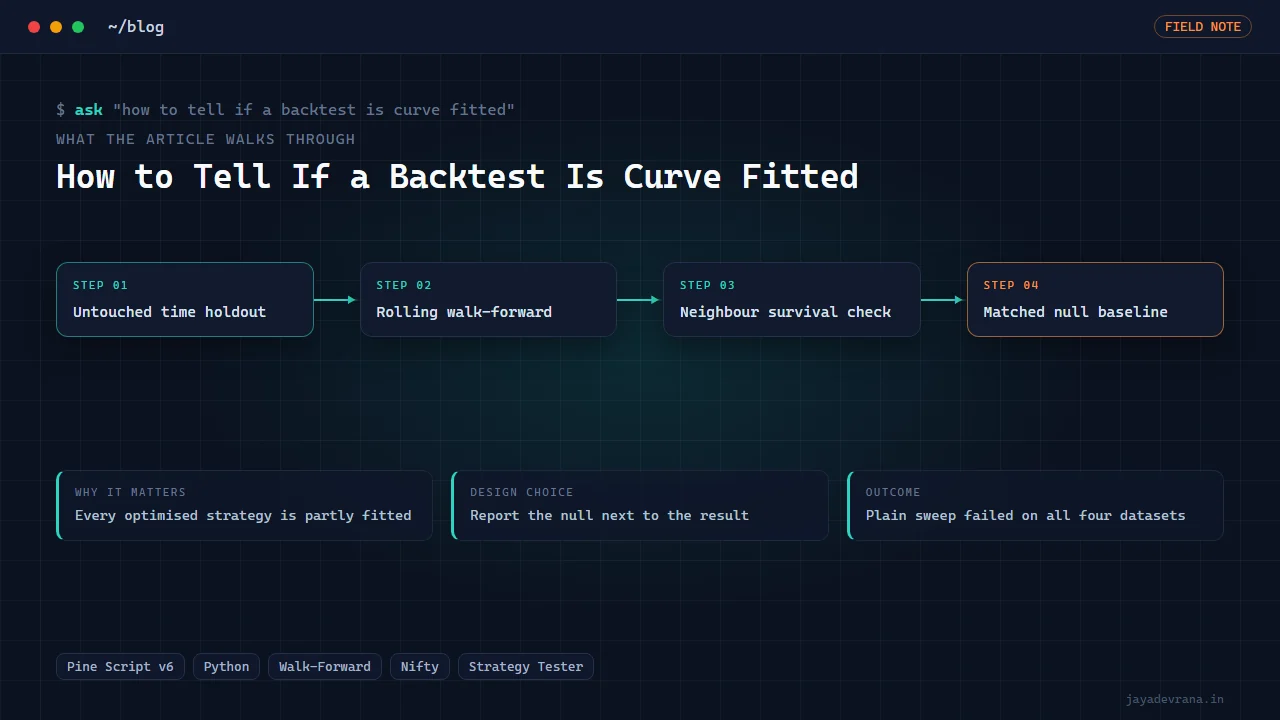
You can tell a backtest is curve fitted when its performance does not survive data it was not optimised on, when small changes to its parameters destroy it, or when a deliberately dumb baseline with the same constraints does nearly as well. The three tests behind that sentence are a true holdout, a parameter plateau check, and a matched null baseline. Add rolling walk-forward, neighbour survival across variants, and proof that your engine matches the platform's tester, and you have a procedure that turns "this backtest looks great" into a number you can defend.
Most traders run one of these tests, usually the holdout, and often run it badly by peeking at the holdout while tuning. The study I describe below ran all six on a fair-value-gap and order-block strategy for Nifty and BankNifty, and the first result was negative: the plain parameter sweep curve fitted on all four datasets. Only a regime-filtered setting survived, and even then the matched null captured half of its edge. That is what honest curve-fit detection looks like, and this post explains how to do it.
What does curve fitting actually mean in a backtest?
Curve fitting is selecting a strategy's rules or parameters because they performed well on a specific historical sample, in a way that captures the noise of that sample rather than a repeatable structure in the market. The sample has a finite number of trades; any parameter search with enough freedom will find settings that line up with the lucky trades. The more parameters, the smaller the sample, and the more combinations you try, the more certain it is that your best result is partly or entirely noise.
It is not a yes-or-no property. Every optimised strategy is curve fitted to some degree; the question is how much of the backtested edge survives when the fitting is removed, and the tests below each remove it in a different way.
How do I run a holdout that I have not already contaminated?
- Split the data by time, never randomly, into a training set and a holdout you will touch once.
- Do all parameter search, all rule tweaks and all "let me just check one thing" on the training set only.
- When you are finished, and only then, run the final setting on the holdout and record the result.
- If you go back and change anything after seeing the holdout, the holdout is contaminated and you need a fresh one.
The acceptance criterion is agreement, not just profit: the holdout profit factor and the training profit factor should be close. A strategy with a training profit factor of three and a holdout of one has failed, even though one is break-even. In the study below, the surviving setting had training and holdout profit factors that agreed; the failed settings looked wonderful in training and collapsed out of sample on every dataset.
What does walk-forward add that a single holdout does not?
A single holdout tells you about one period. Rolling walk-forward repeats the exercise: optimise on a window, test on the next window, slide forward, and stitch the out-of-sample segments together. The stitched equity curve is what you would have experienced if you had re-optimised on schedule. If most windows are negative out of sample, the strategy's apparent edge came from the specific period you first looked at. Walk-forward on the plain fair-value-gap strategy was mostly negative, which is why the next step was regime filtering rather than more parameter tuning.
How do parameter plateaus and neighbour survival expose a lucky spike?
Plot performance against each parameter. A robust setting sits on a plateau: neighbouring values perform similarly, so a small drift in market behaviour does not matter. A curve-fitted setting is a spike: the chosen value is great and the values on either side are poor. The quantitative version is neighbour survival: of all variants within a step or two of the chosen setting, what fraction is profitable out of sample? In the regime-filtered result below, 89 percent of neighbouring variants were profitable on the holdout, across more than five thousand variants, which is a plateau. A spike would show a handful of winners surrounded by losers.
This test matters more as the sweep grows. The GPU pipeline I use for very large sweeps counts plateau neighbours as a selection criterion for exactly this reason; see is it possible to backtest millions of indicator combinations for how that scales.
Why is a matched null baseline the most honest test?
Because it answers the question "compared to what". Suppose your filtered strategy only takes long trades in the afternoon above the session VWAP on Nifty 15-minute bars, and it is profitable out of sample. How much of that is the entry logic, and how much is simply that going long in the afternoon above VWAP on Nifty was a good idea during that period? Build the null: random long entries, same session window, same VWAP condition, same exits and costs, no fair-value-gap or order-block logic at all. Run it many times and look at its distribution.
In the study, the matched null already captured half of the surviving strategy's edge. That does not make the strategy worthless, but it halves the credit the entry logic can claim and it belongs in the report. A result published without its null is a result that has not been tested.
How do I know my backtest engine is even right?
Everything above assumes the backtest computes the strategy correctly. If you replicate a Pine strategy in another language to sweep it quickly, prove parity first: run both on the same bars and compare trade lists. In the study, the Python engine was validated against the TradingView Strategy Tester on 318 positions and matched within 0.2 percent, but only after fills were adjusted to mirror the tester's intrabar path rules. Before that adjustment the engine was quietly optimistic. An engine that is not tester-matched will happily curve fit to its own bugs.
How I built this: FVG + Order-Block Retest Strategy with Honest Regime Filtering
The FVG and order-block retest strategy with honest regime filtering asked whether a popular zone-retest idea has measurable edge on Indian index futures. The workflow was the six tests above, in order:
- Extract Nifty and BankNifty bars from the chart over the DevTools Protocol, for two symbols and the relevant timeframes, giving four datasets.
- Replicate the Pine strategy in Python and prove parity. 318 positions matched the TradingView tester within 0.2 percent once fills followed the tester's path rules.
- Sweep core parameters with a true holdout. Honest in-sample selection failed the holdout on all four datasets, and rolling walk-forward was mostly negative. That was the first finding, and it was recorded as such.
- Add regime filters and sweep again. Session VWAP, EMA, ADX, ATR, time windows and direction filters produced 1.75 million combinations. One family survived: long-only afternoon entries above session VWAP on Nifty 15-minute, with training and holdout profit factors in agreement and 89 percent of neighbouring variants profitable out of sample. BankNifty never reached the bar on any filter.
- Compare with a matched null. Random afternoon longs above VWAP with the same exits captured half of the surviving edge, which went into the report next to the result.
- Set Pine defaults to the surviving setting and attach it to the chart, with the Strategy Tester confirming the engine's numbers.
Two engineering lessons came out of it and are now rules I apply everywhere. Zone strategies must cap risk in ATR terms and carry a time stop, because one giant zone left a trade open for months and skewed an entire sweep. And in Pine, issuing a cancel-all after a close-all cancels the close itself, so time-based and end-of-day exits silently never fire; that bug would have made every backtest look different from live. The outcome is a strategy whose published numbers come with their holdout, their plateau, their null and their tester parity, and a documented negative result for the variants that did not survive. Backtest research like this is engineering, not financial advice; anyone trading the result does so at their own risk.
FAQ
How much data do I need before curve-fit tests mean anything?
Enough trades, not enough bars. A few hundred trades in training and a hundred or more in the holdout is a reasonable floor for a single-strategy study. With fewer, the plateau and null tests become noisy themselves and you should widen the symbol set or timeframe rather than trust a thin sample.
Is a high profit factor a sign of curve fitting?
On its own it is a warning sign, especially with few trades or many parameters. A profit factor that stays similar from training to holdout is more informative than its absolute level. Very high in-sample figures that halve out of sample are the classic signature.
Can regime filters themselves be curve fitted?
Yes, and adding 1.75 million filter combinations is exactly the kind of search that invites it. That is why the surviving filter had to pass the holdout, the neighbour-survival test and the null baseline, not just rank first in training. Filters that only worked on one symbol, as every BankNifty variant did, were rejected.
What should a backtest report always include?
The train and holdout split with both results, the walk-forward segments, the parameter plateau or neighbour-survival figure, the matched null distribution, the engine's parity with the platform tester, and the costs assumed. A report missing any of these has not tested for curve fitting; it has displayed a backtest.
If you want an existing strategy put through these six tests with a written report, or a new one researched this way, tell me about it on the contact page.
Building something in this space? I ship trading automation, Pine Script, MQL5 EAs, and full-stack tools with source and docs.
Start a project →