How to Add SL/TP Lines and a Trade Journal Table to a Pine Indicator
How to add SL TP lines and a trade journal table to a TradingView indicator in Pine v6: a signal state machine, ATR levels, line objects and a results table.
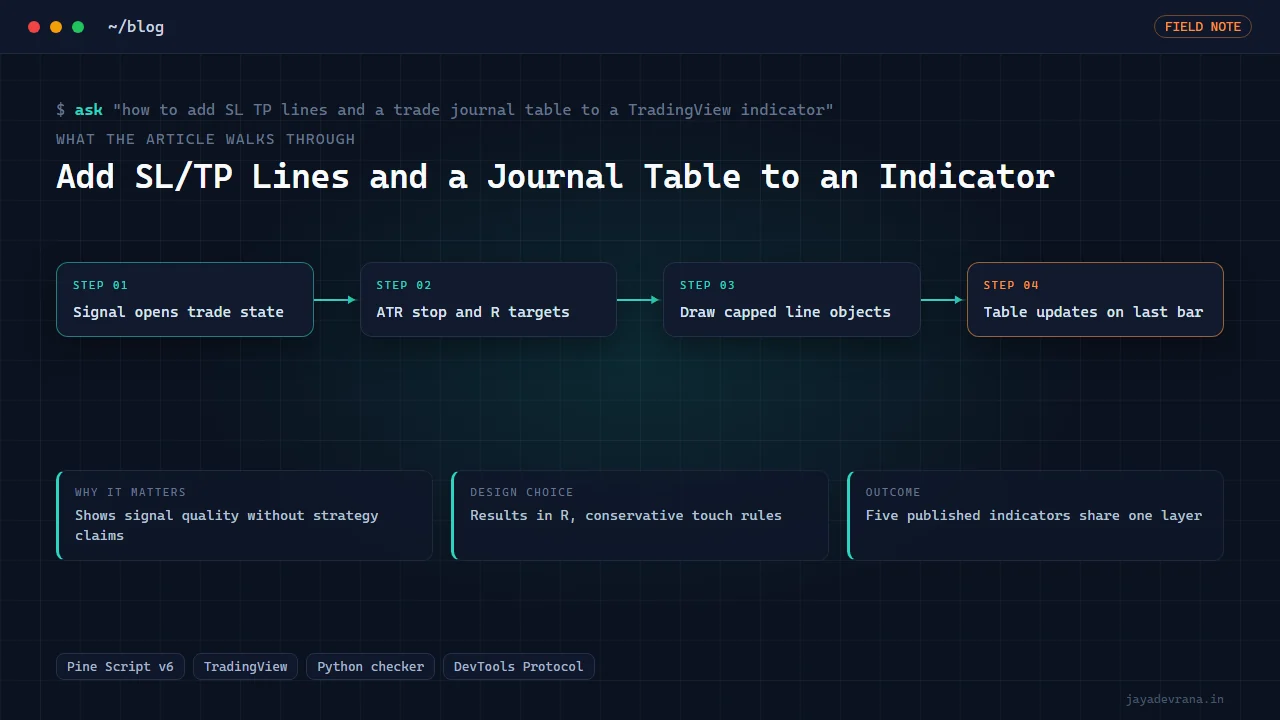
To add SL TP lines and a trade journal table to a TradingView indicator, you give the indicator a small trade state machine: when a signal fires, it records the entry price, computes a stop and one or more targets (usually from a volatility measure such as the average true range), draws those as horizontal line objects that extend until the trade resolves, and then writes the outcome into a results table drawn in a corner of the chart. The indicator never places orders; it tracks hypothetical outcomes so the viewer can judge the signal at a glance.
I built this as a shared layer across five indicators I published in one batch, each implementing a well-known trader's method, so that every one of them showed entry, stop and target lines plus a journal table without duplicating the logic five times. Here is how the layer works, the Pine v6 traps that bite along the way, and why the owner's rule was indicators, not strategies. Nothing here is financial advice; the journal tracks what the rules would have done, not what you should do.
Why add SL/TP lines to an indicator instead of writing a strategy?
A strategy script gives you the Strategy Tester, which is powerful, but it also changes what the script is. Strategies carry performance panels, commission settings and a reputation problem: viewers assume the equity curve is a promise. For published, free indicators the owner's rule was clear: indicators only, with rich on-chart visuals that let a viewer evaluate the method themselves.
An indicator with entry, stop and target lines and a journal table gives most of what a viewer wants from a tester (did the last twenty signals reach the target or the stop?) while staying honest about what it is. It also keeps the script in the indicator category on the platform, which matters for how it is discovered.
How does the signal state machine work?
The core is a handful of persistent variables that survive from bar to bar:
- Direction: flat, long or short.
- Entry price, stop price, target prices.
- The bar index where the trade opened, for expiry.
- Running counters: wins, losses, open, and the sum of outcomes in risk multiples.
On each bar the logic runs in a fixed order. First, if a trade is open, check whether the bar's high or low touched a target or the stop, resolve the trade, update the counters and freeze the lines. Second, if no trade is open (or the method allows reversal) and the method's signal condition is true, open a new trade: record the entry, compute stop and targets, create the line and label objects. Third, apply housekeeping: a maximum trade duration in bars, a cooldown after a resolution, and a cap on how many historical trade drawings are kept so the object limit is never hit.
Order matters because a bar can both resolve the previous trade and trigger a new one; resolving first keeps the journal accurate.
How should the stop and targets be computed?
The methods in my batch differ in their entry logic but share level logic: a stop at a multiple of the average true range from entry, and targets at fixed risk multiples (one, two and three times the stop distance). Expressing targets in risk multiples rather than price units makes the journal comparable across symbols and timeframes, and it lets the table report results in R rather than in rupees or dollars, which avoids any suggestion of a profit figure.
Two choices to make deliberately: whether the stop uses the bar's close or its extremes for the touch test (I use extremes, which is conservative for the signal), and whether a bar that touches both stop and target counts as a loss (I treat ambiguous bars as losses, since intrabar order is unknown).
How do you draw the lines and labels without hitting object limits?
Pine indicators can hold a limited number of line and label objects. A naive implementation that creates three lines and a label per signal will start deleting its oldest drawings silently after a few hundred trades, often in the middle of the history the viewer is looking at. The layer handles this by:
- Keeping references to each trade's drawings in arrays, and deleting the oldest set when the count exceeds a user-set maximum.
- Extending the open trade's lines to the current bar each update, then fixing their right end at the bar where the trade resolved.
- Colouring resolved lines by outcome and placing a single label at resolution with the result in R, so the chart reads like an annotated journal.
This TradingView build I record on does not paint drawing objects in the recording window, so for the lesson videos the journal was presented as a table; on a normal chart the lines render as expected. Know your rendering environment.
How is the journal table built?
A table object in a chart corner, created once and updated on the last bar only, which is both faster and avoids the table flickering on every historical bar. Rows: total signals, wins, losses, win rate, average R, best and worst trade, current open trade's status. A header row names the method and the active settings so a screenshot is self-describing. Updating on the last bar also means the table always reflects the full history, not a partial state.
What Pine v6 traps show up in this kind of indicator?
Three cost me real debugging time across the batch and a related confluence indicator:
- Unseeded booleans during warm-up are not false, they are na, and a ternary on an na condition falls through to the else branch. A gate built on an indicator that has not warmed up fired a phantom short on the first bar. Resolve conditions into integers through a data-ready gate before branching.
- A latching one-trade-at-a-time state machine without an expiry held its direction for 1,809 bars and silently suppressed every later signal. Every state machine needs a bar-based expiry, a cooldown and an explicit allow-reversal flag.
- Comma-chained statements on one line compile in some contexts and not others. One statement per line, always.
The diagnostic method that found these was to plot internal values to the data window and read them back per bar, rather than staring at the chart.
How I built this: the TradingView Auto-Publish Toolkit and the famous-trader batch
The SL/TP and journal layer shipped as part of my TradingView Auto-Publish Toolkit, in the third batch of original scripts: five indicators implementing the methods of Minervini, Williams, Raschke, Dennis and Darvas, each with its own entry logic and the shared trade-journal layer of entry, stop and target lines and a results table. The workflow for each indicator was:
- Draft the method's entry conditions and wire them to the shared state machine, then compile-check offline before touching the chart.
- Stage the script in TradingView Desktop over the DevTools Protocol in a scratch layout: fresh script, source loaded, saved, added to the chart.
- Verify numerically: a verifier reads back plots and table cells to confirm the journal counts match what a bar-by-bar check expects.
- Optimise level parameters where the method allows it, with an in-sample and out-of-sample split by trade exit time.
- Write a moderation-safe description that describes the method and the journal without performance claims, pick categories, and publish with the scheduler spacing publishes to respect platform limits.
Design decisions: one shared layer across five methods, results in R rather than currency, conservative touch rules, object-count caps, and indicators rather than strategies. The outcome was five published indicators with a consistent journal grammar, verified before each publish. A related build where the state-machine traps were first found is my Predicta V4 confluence indicator, and the non-repainting discipline behind the signals is covered in Pine Script to production without repainting.
FAQ
Can the journal table be trusted as a backtest?
It is a bar-by-bar tally of what the rules would have done with the chosen stop and targets, using bar extremes for touches. It ignores commissions, slippage and position sizing. Treat it as a quick read on signal quality, not as a tester report.
Does drawing lines slow the chart down?
Line and label objects are cheap up to the platform's limits; the cost comes from updating hundreds of them every bar. Updating only the open trade's lines and the table on the last bar keeps the indicator responsive.
Can alerts fire on entry, stop and target?
Yes. The state machine's transitions are natural alert conditions: trade opened, stop hit, target hit. Each can carry a message with the levels for downstream automation, which is how my bridge projects consume them.
Why ATR for the stop and not a fixed percentage?
A volatility-based stop scales with the instrument and the timeframe, so the same indicator behaves sensibly on a quiet index and a volatile small cap. A fixed percentage would need retuning per symbol.
If you want an indicator built with levels, a journal and alerts for your method, tell me about it on the contact page.
Building something in this space? I ship trading automation, Pine Script, MQL5 EAs, and full-stack tools with source and docs.
Start a project →