How to Build a Crypto Trading Terminal With Binance Perpetual Data
How to build a crypto trading terminal with Binance perpetual data: public endpoints for 210 USDT perps, a snapshot contract, canvas flow board, browser tests.
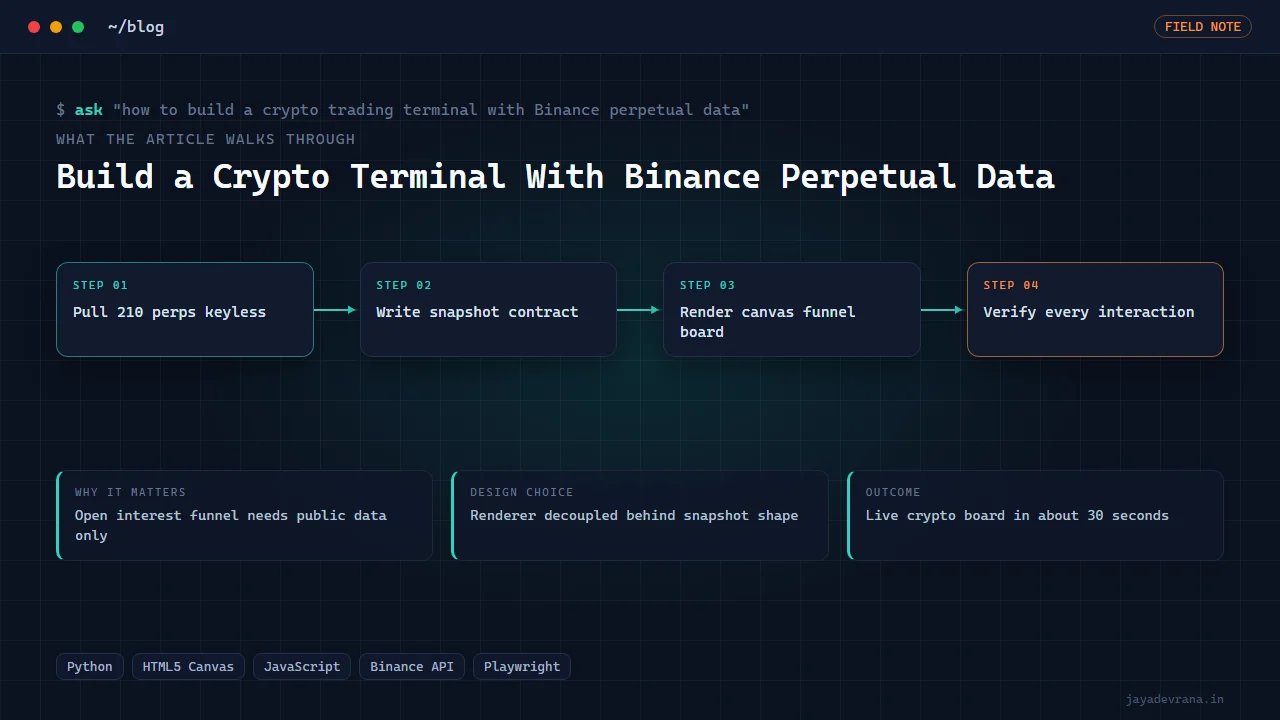
To build a crypto trading terminal with Binance perpetual data you need three layers: a feed that pulls tickers, candles and open interest for the perpetual contracts you care about and writes them into one snapshot in a fixed shape; a rendering layer that turns that snapshot into something a trader can scan in seconds; and an interaction layer that lets them hover, pin and inspect without losing context. Binance's public futures endpoints give you the first layer without an API key, and a canvas-based board gives you the second two in a single page.
I built this as a replica of a trader-facing terminal whose signature view was an open-interest funnel narrowing hundreds of futures and options names into a handful of tickets. The original served Indian derivatives; my version runs live against the top 210 Binance USDT perpetuals in about 30 seconds from a cold start. This post walks through the data, the board, and the testing discipline that separated the version worth shipping from the first draft that looked right and did nothing. It is engineering, not financial advice; readers trade their own accounts at their own risk.
What Binance perpetual data can you get without an API key?
More than most people assume. The public futures endpoints serve, without authentication:
- 24-hour tickers for every USDT-margined perpetual: last price, percentage change, volume, quote volume.
- Candles at any standard interval, which I pull at 15 minutes for intraday structure.
- Open interest and open-interest history per symbol, which is the input that makes a funnel view possible at all.
- Funding rates and mark prices, useful for context columns.
The constraints are rate limits by request weight and the absence of anything account-specific. For a read-only terminal that is fine. My feed ranks symbols by quote volume, keeps the top 210, and fetches tickers, 15-minute klines and open-interest history for each with polite concurrency. The whole refresh completes in roughly 30 seconds. The official reference is at https://binance-docs.github.io/apidocs/futures/en/ and is the only source I trust for endpoint behaviour.
Why write a snapshot file instead of rendering straight from the API?
Because the renderer should not care where data comes from. The terminal defines a snapshot contract: a single document with a timestamp and, per symbol, the fields the funnel needs (price, change, volume, open interest and its change, a short series for sparklines). Three feeds write that shape:
- A seeded generator for development and demos, so the board always has data.
- The Binance crypto feed described above.
- An NSE feed slot that goes live the moment anything writes a snapshot in the documented shape.
This separation is what let the same board serve crypto in production while the Indian derivatives mode waited for a licensed feed. It also makes the renderer trivially testable: hand it a known snapshot, assert the pixels and the DOM.
How does the open-interest funnel work?
The funnel is a sequence of stages, each a filter or ranking applied to the symbol set, drawn as narrowing columns from left to right. Typical stages: all symbols by volume, those with rising open interest, those where open interest and price move together, those with a 15-minute structure break, down to a handful of tickets on the right. Each symbol keeps its lineage, meaning the board knows which stages it passed and where it dropped out.
Rendering happens on a single canvas rather than hundreds of DOM nodes, which keeps hover response instant even with 210 names and their connectors. One scale decision mattered: when the biggest movers exceed about eight percent, a linear axis crushes everything else into a line. The renderer switches to an inverse hyperbolic sine scale in that regime, which behaves like linear near zero and like logarithmic in the tails, so both the quiet majority and the outliers stay readable.
What makes the interaction layer feel like a professional terminal?
Three behaviours, all reproduced from the original by observing it rather than copying it:
- Linked brushing: hovering a symbol anywhere lights its entire lineage across every funnel stage and populates an inspector panel with its numbers and sparkline. Everything else dims.
- Click to pin: a click freezes the highlight so the trader can move the mouse to the inspector or compare a second name; a second click releases it.
- A build-in animation of about four and a half seconds on load, with an ambient particle loop afterwards. This sounds cosmetic, but it communicates "data is arriving" and sets the visual rhythm the original was known for.
Keyboard shortcuts cover stage navigation and pin release, so a trader never has to reach for the mouse to clear state.
How do you test a canvas terminal properly?
My first version was a set of screenshots stitched into a page, and it was rightly judged static and sloppy. The second version was built from a layer map of the original: the DOM geometry, the page's event handlers and function names, and screenshots at each interaction state. Then every hover, click and key on my board was exercised in a browser automation script before anything was called done.
The test script loads the page with a known snapshot, hovers specific symbols and asserts the inspector contents, pins and unpins, triggers each keyboard shortcut, navigates to every page of the shell, and fails on any console error. Zero console errors is a hard gate. Canvas content is checked by reading back pixel regions at known coordinates. This is more work than unit-testing a function, and it is the only way to know a terminal actually works.
How I built this: the OrderBlock Terminal Replica
The OrderBlock Terminal Replica is a hash-routed single-page application with the flow board at its centre and journal, learn, community, feedback and settings pages around it; the learning page embeds my real lesson videos. Its workflow is:
- A feed (seeded generator, Binance crypto, or an NSE writer) produces a snapshot in the documented shape.
- The funnel engine computes stage membership and lineage per symbol.
- The canvas renderer draws the board with the build-in animation, switching to the inverse-sine scale when movers exceed eight percent.
- Hover and click drive lineage highlighting, the inspector and pinning; keys handle navigation.
- A browser automation script verifies every page and interaction with zero console errors.
Design decisions: rebuild from behaviour rather than source, decouple the renderer behind a snapshot contract, draw on a single canvas, and treat browser-verified interaction as the definition of done. The outcome is a live crypto flow board from public endpoints in about 30 seconds, with the Indian derivatives mode ready for a feed. If the execution side interests you, my TradingView to Binance futures bridge covers how I route orders with risk rails; this terminal is read-only by design.
FAQ
Does the terminal place orders on Binance?
No. It reads public market data and renders it. Order execution is a separate concern with authentication, risk limits and audit requirements, and keeping the terminal read-only means anyone can run it without exposing an account.
How fresh is the data?
Each refresh is a full pull of the top 210 perpetuals and takes about 30 seconds. For a scanning board that is adequate; a tick-by-tick view would use the streaming endpoints and a different renderer path.
Can it run on Indian derivatives data?
The NSE mode is wired and waits for a feed that writes the snapshot shape. Indian exchange data requires a licensed vendor or broker API, which is why the crypto mode shipped first.
Why a replica rather than an original design?
The client wanted the specific interaction grammar of a terminal they already used, and the original's source was an obfuscated bundle that was neither available nor the point. Reproducing behaviour from observation, then verifying it, is a legitimate and common engineering task.
If you want a market-data terminal like this built on your feed or exchange, tell me about it on the contact page.
Building something in this space? I ship trading automation, Pine Script, MQL5 EAs, and full-stack tools with source and docs.
Start a project →