How to Build a Trading Dashboard With Angel One SmartAPI (2026)
How to build a trading dashboard with Angel One SmartAPI: server-side login, symbol search, candles, charts, a scanner, a P&L ledger and the API quirks.
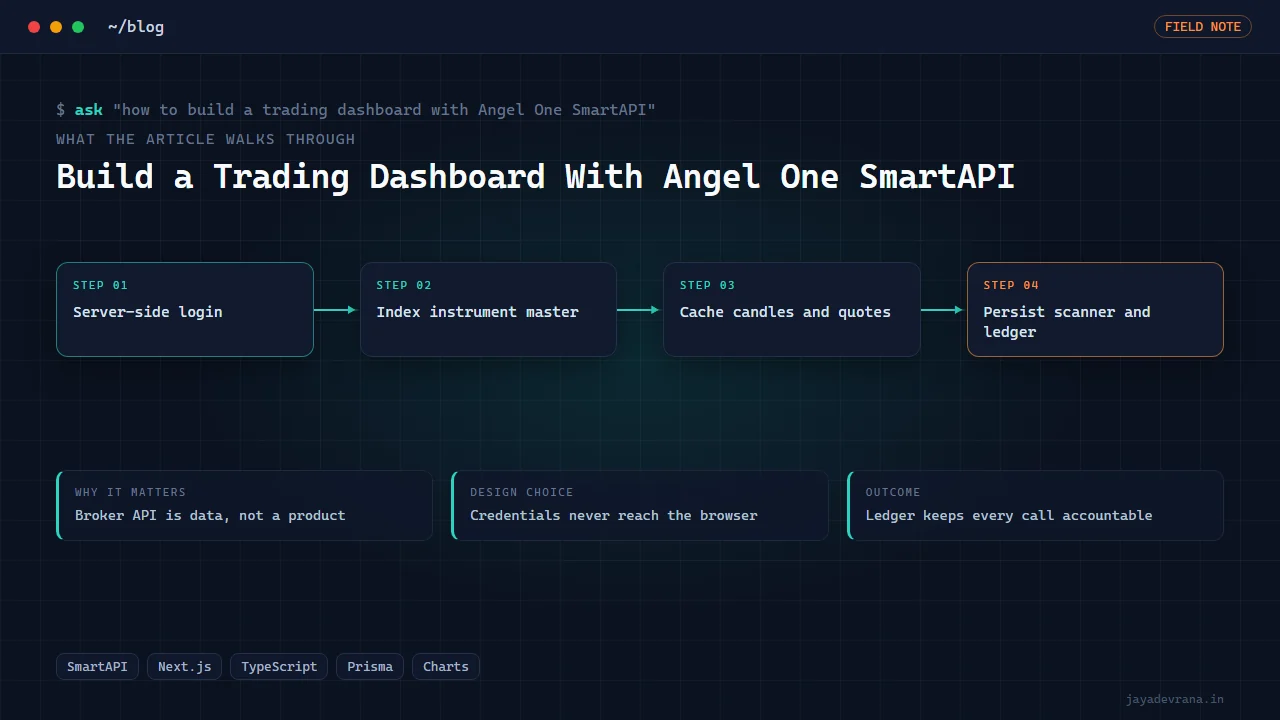
To build a trading dashboard with Angel One SmartAPI you wrap the broker login on a server you control, expose a handful of your own endpoints for symbol search, last traded price, historical candles and positions, render those in a web front end with a charting component, and persist whatever the broker does not keep for you, such as a watchlist, a scanner's results or a ledger of your own trade ideas. The broker API gives you data and order placement; the dashboard is the layer that makes it usable by a person every day.
The part nobody tells you before you start is that SmartAPI has a set of quirks that will each cost you an afternoon if you discover them in production: historical-candle calls need spacing between them, the instrument master contains test contracts that must be filtered out, option strikes come back in paise, quotes are live-only, and after the close the depth shows zero bids. This post lays out the architecture, the data flow and those quirks, and then describes the Angel One SmartAPI trading terminal I built on exactly this plan.
What does SmartAPI provide, and what do I have to build?
Angel One's SmartAPI is a REST and websocket API for the broker's clients, documented at https://smartapi.angelbroking.com/docs. It provides:
- Login with client code, PIN and a time-based one-time password, returning a session token you must refresh.
- Market data: last traded price, full quotes with market depth, and historical candles by instrument token and interval.
- A downloadable instrument master listing every tradable contract across exchanges.
- Order placement, modification and cancellation, plus the order book, trade book, positions and holdings.
- A websocket for streaming ticks.
What you build is everything a trader touches: the login handling and token refresh, a searchable symbol index built from the instrument master, caching so you do not hammer the candle endpoint, the charts, any scanner logic, and persistent storage for things the broker has no concept of, like your own list of recommendations with their outcomes.
How should the login and session be handled?
Server-side, always. The dashboard's browser code should never hold the API key, the client secret or the session token. A server route performs the SmartAPI login with the credentials from a protected configuration, stores the session, refreshes it on schedule, and exposes only your own authenticated endpoints to the front end. This keeps the broker credentials off every device the dashboard is opened on and lets you rotate them in one place.
Because SmartAPI login needs a time-based code, the server either reads the authenticator secret from configuration to generate the code itself, or prompts the user for it each morning. For a personal research terminal the first is convenient; for anything multi-user, the second is the safer default.
How do I get symbols, prices and candles into the dashboard?
- Download the instrument master once a day. It is a large file listing every contract. Load it into a database or an in-memory index, and filter out the test contracts Angel One includes, or they will appear in your search results and fail when queried.
- Build symbol search on your own index. SmartAPI's own search is limited; a local index over the master gives instant results and lets you show exchange, expiry and strike cleanly.
- Fetch last traded price on demand. The quote endpoints return live data only; there is no "price as of yesterday", so your dashboard must store any snapshot it wants to show later.
- Fetch historical candles with spacing. The candle endpoint rejects rapid-fire calls. In practice around two and a half seconds between requests keeps it stable. Queue chart requests and cache the results so switching between two symbols does not trigger a fresh download each time.
- Use full quotes carefully. The full market-data mode returns five levels of depth and accepts up to fifty tokens per call, which is ideal for a scanner's watch page. After the close the bid side reads zero, so any logic that divides by bid size needs a guard.
- Convert option strikes. Strikes in the master are stored in paise; divide by one hundred before display or everything looks a hundred times too expensive.
Each of these is small. Together they are the difference between a dashboard that works at 9:20 on Monday and one that falls over.
What charting component should I use?
A TradingView-style chart is what traders expect, and a lightweight candlestick charting library in the browser delivers it well for a research dashboard: candles, volume, a few overlays, crosshair and zoom. Feed it the cached candles from your server and update the last candle from the quote endpoint or the websocket. If you intend to resell the dashboard or run it as a white-label product, check the charting library's licence terms before you commit, because the free tiers of the well-known options restrict exactly that use.
How do I add a scanner and keep it honest?
A scanner is a loop over a universe of instruments that computes a metric and sorts. For equities, a book-value or price-to-book scanner needs fundamental data SmartAPI does not provide, so you combine broker prices with a fundamentals source you maintain. The engineering rule is that scanner results must be timestamped and stored. A scanner that only shows "now" cannot be evaluated later, and evaluation is the whole point.
The same principle applies to a recommendation ledger: when the dashboard or its user logs an idea, record the instrument, the entry price at the time, the thesis and the date, then compute running profit and loss from live prices. Ideas that worked and ideas that did not both stay visible. That accountability is a feature, not a report. This is research tooling, not financial advice; what a user does with a ledger entry is their own trading decision at their own risk.
How I built this: Angel One SmartAPI Trading Terminal
My Angel One SmartAPI trading terminal is a Next.js and TypeScript application with Prisma for persistence, built as a research and monitoring surface for Indian equities. The build followed the plan above:
- Server-side login wrapper. A server route performs the SmartAPI login and keeps the session; the browser only ever talks to the application's own endpoints. Credentials live in configuration on the server.
- Instrument index and symbol search. The daily instrument master is loaded, test contracts filtered, and a local search index built so symbol lookup is instant and shows the exchange and contract details.
- LTP and historical candles with a request queue. Price and candle endpoints are wrapped with caching and the spacing SmartAPI needs, so the chart page never trips the rate limit when a user flips between symbols.
- TradingView-style charts. Candles render in a browser charting component fed from the cached data, with the latest bar refreshed from live quotes.
- Book-value scanner. A screening view ranks equities on book-value metrics, with results stored and timestamped so a scan can be revisited.
- Recommendation ledger with running P&L. Ideas are recorded with their entry price and date, and the dashboard computes live profit and loss per idea, so past calls remain accountable instead of disappearing.
The design decisions that mattered: keep the broker credentials on the server, treat the instrument master as data to clean rather than trust, and make everything the scanner or the ledger produces persistent and dated. The SmartAPI facts verified during this build, the five-level depth and fifty-token limit, paise strikes, candle spacing, live-only quotes, test contracts and zero post-close bids, became a shared reference I reused in later Angel One projects including an options terminal and a cash-and-futures arbitrage scanner.
The outcome is a broker API turned into a usable analysis surface, and a template I apply when a client asks for a dashboard on any Indian broker API. If you are comparing brokers before you build, my notes on broker choice for TradingView automation in India cover the API side.
FAQ
Is SmartAPI free to use?
Angel One has offered SmartAPI access to its clients without a separate API subscription fee, which is one reason it is popular for personal dashboards. Check the current terms on the developer portal, because data entitlements and rate limits are set by the broker and can change.
Can the dashboard place orders too?
SmartAPI supports order placement, so yes, technically. A research dashboard and an execution terminal have different safety requirements; if you add orders, add confirmation steps, position limits and a kill switch, and test exhaustively on small quantities before relying on it.
Why do my historical candle requests keep failing?
Almost always rate limiting. Space the calls, around two and a half seconds apart in my experience, cache aggressively, and never fetch candles in a tight loop over a watchlist. Also confirm the instrument token is a real contract and not one of the test entries in the master.
Can I stream live prices instead of polling?
Yes, through the SmartAPI websocket. For a dashboard with a few dozen symbols on screen, a server-side websocket client that fans out to the browser over your own channel is cleaner than each browser connecting to the broker directly.
If you want a dashboard like this built on Angel One or another Indian broker API, tell me what you need it to show on the contact page.
Building something in this space? I ship trading automation, Pine Script, MQL5 EAs, and full-stack tools with source and docs.
Start a project →